One way to tackle the problem if you are calling lots of different functions and you are unsure where the swapping comes from would be to use the new plotting functionality from memory_profiler. First you must decorate the different functions you are using with @profile. For simplicity I'll use the example examples/numpy_example.py shipped with memory_profiler that contains two functions: create_data() and process_data()
To run your script, instead of running it with the Python interpreter, you use the mprof executable, that is
$ mprof run examples/numpy_example.py
This will create a file called mprofile_??????????.dat, where the ? will hold numbers representing the current date. To plot the result, simply type mprof plot and it will generate a plot similar to this (if you have several .dat files it will always take the last one):
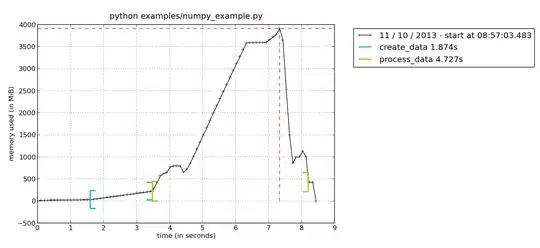
Here you see the memory consumption, with brackets indicating when you enter/leave the current function. This way it is easy to see that function process_data() has a peak
of memory consumption. To further dig into your function, you could use the line-by-line profiler to see the memory consumption of each line in your function. This is run with
python -m memory_profiler examples/nump_example.py
This would give you an output similar to this:
Line #    Mem usage    Increment   Line Contents
================================================
    13                             @profile
    14  223.414 MiB    0.000 MiB   def process_data(data):
    15  414.531 MiB  191.117 MiB       data = np.concatenate(data)
    16  614.621 MiB  200.090 MiB       detrended = scipy.signal.detrend(data, axis=0)
    17  614.621 MiB    0.000 MiB       return detrended
where it is clear that scipy.signal.detrend is allocating a huge amount of memory.