East Sussex County Council elections
East Sussex County Council in England is elected every four years.
Council composition
| Year | Conservative | Labour | Liberal Democrats[a] | Green | UKIP | Independents & Others |
Council control after election | |
|---|---|---|---|---|---|---|---|---|
| Local government reorganisation; council established (84 seats) | ||||||||
| 1973 | 49 | 19 | 9 | – | – | 7 | Conservative | |
| 1977 | 74 | 5 | 2 | 0 | – | 3 | Conservative | |
| 1981 | 53 | 14 | 15 | 0 | – | 2 | Conservative | |
| New division boundaries (70 seats) | ||||||||
| 1985 | 35 | 14 | 21 | 0 | – | 0 | No overall control | |
| 1989 | 38 | 17 | 15 | 0 | – | 0 | Conservative | |
| 1993 | 22 | 18 | 30 | 0 | – | 0 | No overall control | |
| Brighton and Hove become a merged unitary authority (44 seats) | ||||||||
| 1997 | 21 | 7 | 16 | 0 | 0 | 0 | No overall control | |
| 2001 | 24 | 7 | 13 | 0 | 0 | 0 | Conservative | |
| New division boundaries (49 seats) | ||||||||
| 2005 | 29 | 5 | 14 | 0 | 0 | 1 | Conservative | |
| 2009 | 29 | 4 | 13 | 0 | 0 | 3 | Conservative | |
| 2013 | 20 | 7 | 10 | 0 | 7 | 5 | No overall control | |
| New division boundaries (50 seats) | ||||||||
| 2017 | 30 | 4 | 11 | 0 | 0 | 5 | Conservative | |
| 2021 | 27 | 5 | 11 | 4 | 0 | 3 | Conservative | |
County result maps
-
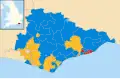 2005 results map
 -
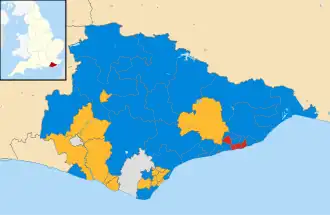 2009 results map
 -
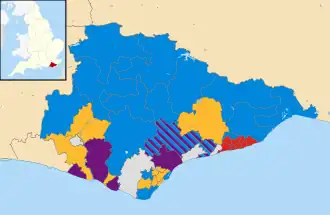 2013 results map
 -
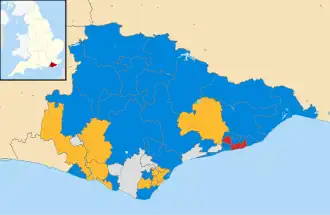 2017 results map
 -
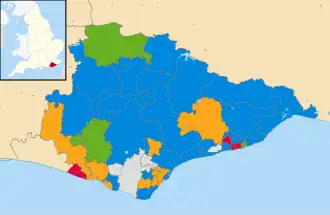 2021 results map
By-election results
1989–1993
| Party | Candidate | Votes | % | ±% | |
|---|---|---|---|---|---|
| Conservative | Simon Radford-Kirby | 990 | 49.0 | ||
| Labour | John Stevens | 923 | 45.7 | ||
| Liberal Democrats | Martin Jones | 108 | 5.3 | ||
| Majority | 67 | 3.3 | |||
| Turnout | 2,021 | ||||
| Conservative gain from Labour | Swing | ||||
1993–1997
| Party | Candidate | Votes | % | ±% | |
|---|---|---|---|---|---|
| Liberal Democrats | 1,198 | 58.9 | |||
| Conservative | 530 | 26.1 | |||
| Labour | 305 | 15.0 | |||
| Majority | 668 | 32.8 | |||
| Turnout | 2,033 | 24.4 | |||
| Liberal Democrats hold | Swing | ||||
1997–2001
| Party | Candidate | Votes | % | ±% | |
|---|---|---|---|---|---|
| Labour | 798 | 53.4 | +15.4 | ||
| Conservative | 358 | 24.0 | −4.3 | ||
| Liberal Democrats | 337 | 22.6 | −11.1 | ||
| Majority | 440 | 29.4 | |||
| Turnout | 1,493 | 15.5 | |||
| Labour hold | Swing | ||||
| Party | Candidate | Votes | % | ±% | |
|---|---|---|---|---|---|
| Labour | 885 | 59.5 | +15.7 | ||
| Liberal Democrats | 343 | 23.1 | −6.9 | ||
| Conservative | 259 | 17.4 | −5.5 | ||
| Majority | 542 | 36.4 | |||
| Turnout | 1,487 | ||||
| Labour hold | Swing | ||||
| Party | Candidate | Votes | % | ±% | |
|---|---|---|---|---|---|
| Liberal Democrats | 1,786 | 54.8 | +12.5 | ||
| Conservative | 1,476 | 45.2 | +2.1 | ||
| Majority | 310 | 9.6 | |||
| Turnout | 3,262 | ||||
| Liberal Democrats gain from Conservative | Swing | ||||
| Party | Candidate | Votes | % | ±% | |
|---|---|---|---|---|---|
| Conservative | 1,027 | 43.9 | +5.4 | ||
| Labour | 773 | 33.0 | +1.2 | ||
| Liberal Democrats | 542 | 23.1 | −6.5 | ||
| Majority | 254 | 10.9 | |||
| Turnout | 2,342 | 22.7 | |||
| Conservative hold | Swing | ||||
2001–2005
| Party | Candidate | Votes | % | ±% | |
|---|---|---|---|---|---|
| Conservative | Martin Kenward | 1,117 | 61.6 | +19.6 | |
| Liberal Democrats | 695 | 38.4 | +14.7 | ||
| Majority | 422 | 23.2 | |||
| Turnout | 1,812 | 23.7 | |||
| Conservative hold | Swing | ||||
2005–2009
| Party | Candidate | Votes | % | ±% | |
|---|---|---|---|---|---|
| Conservative | Simon Radford-Kirby | 1,293 | 70.0 | +20.1 | |
| Liberal Democrats | Cynthia Dewick | 406 | 22.0 | −10.6 | |
| Labour | Robert Walker | 147 | 8.0 | −9.5 | |
| Majority | 887 | 48.0 | |||
| Turnout | 1,846 | 25.7 | |||
| Conservative hold | Swing | +15.4% | |||
| Party | Candidate | Votes | % | ±% | |
|---|---|---|---|---|---|
| Conservative | Michael Ensor | 2,825 | 62.3 | +23.1 | |
| Liberal Democrats | John Kemp | 1,191 | 26.3 | −4.3 | |
| Labour | Timothy Macpherson | 518 | 11.4 | −18.8 | |
| Majority | 1,634 | 36.0 | |||
| Turnout | 4,534 | 25.0 | |||
| Conservative hold | Swing | ||||
2013–2017
| Party | Candidate | Votes | % | ±% | |
|---|---|---|---|---|---|
| Labour | Tania Charman | 961 | 56.5 | +7.3 | |
| Conservative | Robert Cooke | 368 | 21.6 | +6.0 | |
| UKIP | Sebastian Norton | 174 | 10.2 | −12.3 | |
| Green | Andrea Needham | 149 | 8.8 | +0.5 | |
| Liberal Democrats | Stewart Rayment | 48 | 2.8 | −1.6 | |
| Majority | 593 | 34.9 | |||
| Turnout | 1,700 | ||||
| Labour hold | Swing | ||||
| Party | Candidate | Votes | % | ±% | |
|---|---|---|---|---|---|
| Labour | Judy Rogers | 1,441 | 46.2 | +5.4 | |
| Conservative | Martin Clarke | 1,253 | 40.2 | +6.7 | |
| Green | Julie Hilton | 214 | 6.9 | +3.3 | |
| Liberal Democrats | Stewart Rayment | 212 | 6.8 | +3.3 | |
| Majority | 188 | 6.0 | |||
| Turnout | 3,120 | ||||
| Labour hold | Swing | ||||
2017–2021
| Party | Candidate | Votes | % | ±% | |
|---|---|---|---|---|---|
| Independent | Deirdre Earl-Williams | 1,761 | 51.9 | +51.9 | |
| Conservative | Martin Kenward | 1,071 | 31.6 | −1.7 | |
| Liberal Democrats | Richard Thomas | 261 | 7.7 | +2.1 | |
| Labour | Jacque Walker | 111 | 3.3 | −3.8 | |
| Green | Polly Gray | 107 | 3.2 | +3.2 | |
| UKIP | Geoffrey Bastin | 81 | 2.4 | −1.2 | |
| Majority | 690 | 20.3 | |||
| Turnout | 3,392 | ||||
| Independent hold | Swing | ||||
2021–2025
| Party | Candidate | Votes | % | ±% | |
|---|---|---|---|---|---|
| Green | Anne Cross | 1,373 | 61.5 | +43.0 | |
| Conservative | Neil Waller | 858 | 38.5 | −20.7 | |
| Majority | 515 | 23.0 | |||
| Turnout | 2,231 | ||||
| Green gain from Conservative | Swing | ||||
| Party | Candidate | Votes | % | ±% | |
|---|---|---|---|---|---|
| Liberal Democrats | Brett Wright | 1,649 | 50.1 | +10.1 | |
| Conservative | Nicholas Taylor | 1,361 | 41.3 | −4.3 | |
| Labour | David Mannion | 157 | 4.8 | −1.1 | |
| Green | Claire Martin | 127 | 3.9 | −2.2 | |
| Majority | 288 | 8.7 | |||
| Turnout | 3,294 | ||||
| Liberal Democrats gain from Conservative | Swing | ||||
See also
- 1985 East Sussex County Council election
- 1989 East Sussex County Council election
- 2005 East Sussex County Council election (boundary changes increased the number of seats by 5)[9]
- 2009 East Sussex County Council election
- 2013 East Sussex County Council election
- 2017 East Sussex County Council election (boundary changes increased the number of seats by 1)[10]
- 2021 East Sussex County Council election
- 2026 East Sussex County Council election (delayed due to local government reorganisation)
Notes
- ^ Includes totals for the predecessors of the Liberal Democrats, the Liberal Party and SDP (both of which participated in the Alliance).
References
- ^ "Composition calculator". Colin Rallings & Michael Thrasher. The Elections Centre, Plymouth University. Retrieved 14 May 2025.
- ^ "Pevensey & Westham Electoral Division" (PDF). Wealden District Council. Archived from the original (PDF) on 27 October 2007. Retrieved 31 August 2009.
- ^ "Declaration of Result of Poll 12 June 2008". Rother District Council. Retrieved 31 August 2009.
- ^ "Local Elections Archive Project — Old Hastings and Tressell Division". www.andrewteale.me.uk. Retrieved 20 February 2024.
- ^ "Local Elections Archive Project — St Helens and Silverhill Division". www.andrewteale.me.uk. Retrieved 20 February 2024.
- ^ "Local Elections Archive Project — Bexhill West Division". www.andrewteale.me.uk. Retrieved 20 February 2024.
- ^ "Local Elections Archive Project — Heathfield and Mayfield Division". www.andrewteale.me.uk. Retrieved 20 February 2024.
- ^ "Local Elections Archive Project — Meads Division". www.andrewteale.me.uk. Retrieved 20 February 2024.
- ^ "Local election results: East Sussex". BBC News Online. Retrieved 31 August 2009.
- ^ "The East Sussex (Electoral Changes) Order 2016", legislation.gov.uk, The National Archives, SI 2016/1225, retrieved 20 February 2024
External links
- East Sussex County Council Archived 14 March 2021 at the Wayback Machine
- East Sussex election results
- By-election results Archived 29 March 2010 at the Wayback Machine
| Current | |
|---|---|
| Former | |
aUnitary authorities referred to as county councils | |