<script src="https://d3js.org/d3.v7.min.js"></script>
<style>
  text.tooltip {
    display: none;
  }

  circle:hover + text.tooltip {
    display: initial;
  }

  circle:hover + foreignobject {
    display: initial;
    color: #ffff00;
    background-color: #015db7;
  }

  /* ↓ used for demo4Histogram only */
  rect:hover + foreignobject {
    display: initial;
  }

  rect:hover {
    fill: red;
  }
</style>
<body></body>
<script>
  const w = 500
  const h = 150
  const dataset = [5, 10, 15, 20, 25]

  function demo1PureJS() {
    const svgFrag = document.createRange().createContextualFragment(`
<header>PureJS</header>
<svg width="400" height="150"><g></g></svg><br>
`)
    const gElem = svgFrag.querySelector(`g`)
    for (const idx in dataset) {
      const r = dataset[idx]
      const [cx, cy] = [idx * 50 + 25, h / 2];

      gElem.insertAdjacentHTML("beforeend", `
<circle cx="${cx}" cy="${cy}" r="${r}" data-tooltip="(${cx}, ${cy})"></circle>
<text class="tooltip" x="${cx}" y="${cy}" fill="red">${r}</text>
`)
      document.body.append(svgFrag)

    }
  }

  function demo2D3js() {
    const svg = d3.select("body")
      .append("svg")
      .attr("width", w)
      .attr("height", h)

    svg.node().insertAdjacentHTML("beforebegin", "<header>demo2D3js</header>")

    svg.selectAll("circle")
      .data(dataset)
      .enter()
      .append("circle")
      .attr("cx", (d, i) => i * 50 + 25)
      .attr("cy", h / 2)
      .attr("r", d => d)
      .text((d, idx, arr) => {
        const circle = arr[idx]
        const x = circle.getAttribute("cx")
        const y = circle.getAttribute("cy")

        const testCase = "foreignobject"
        if (testCase === "foreignobject") { //  focus here
          circle.insertAdjacentHTML("afterend", `
     <foreignobject x="${x}" y="${y}" width="${d.toString().length * 12}" height="26" display="none">
        <div>${d}</div>
     </foreignobject>
    `)

        } else {
          circle.insertAdjacentHTML("afterend", `<text class="tooltip" x="${x}" y="${y}" fill="yellow">${d}</text>`)
        }
        return ""
      })
  }

  function demo3SVGTitle() {
    /*
    https://developer.mozilla.org/en-US/docs/Web/SVG/Element/title
    <rect x="11" y="1" width="8" height="8">
      <title>I'm a square</title>
    </rect>
     */

    const svg = d3.select("body")
      .append("svg")
      .attr("width", w)
      .attr("height", h)

    svg.node().insertAdjacentHTML("beforebegin", "<header>SVGTitle</header>")

    svg.selectAll("circle")
      .data(dataset)
      .enter()
      .append("circle")
      .attr("cx", (d, i) => i * 50 + 25)
      .attr("cy", h / 2)
      .attr("r", d => d)
      .append("svg:title") //  focus here
      .text(d => d)
  }

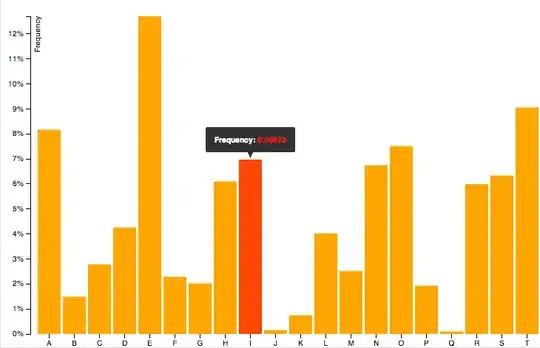
  async function demo4Histogram() {
    const margin = {top: 50, right: 50, bottom: 50, left: 50},
      width = 900 - margin.left - margin.right,
      height = 900 - margin.top - margin.bottom

    const svg = d3.select("body")
      .append("svg")

    svg.node().insertAdjacentHTML("beforebegin", "<header>Histogram</header>")

    const mainG = svg.attr("width", width + margin.left + margin.right)
      .attr("height", height + margin.top + margin.bottom)
      .append("g")
      .attr("transform", `translate(${margin.left}, ${margin.top})`)


    const dataSet = []
    await d3.csv("https://raw.githubusercontent.com/holtzy/data_to_viz/master/Example_dataset/1_OneNum.csv", (row) => {
      dataSet.push(row)
    })

    // X: price
    const scaleX = d3.scaleLinear()
      .domain([0, 2000])
      .range([0, width])

    mainG.append("g")
      .attr("transform", `translate(0,${height})`)
      .call(d3.axisBottom(scaleX)
      )

    const histogram = d3.histogram()
      .value(d => d.price)
      .domain(scaleX.domain())
      .thresholds(scaleX.ticks(50))

    const bins = histogram(dataSet)

    // Y: Count
    const scaleY = d3.scaleLinear()
      .domain([0, d3.max(bins, d => d.length)])
      .range([height, 0])

    mainG.append("g")
      .call(d3.axisLeft(scaleY))

    mainG.selectAll("rect")
      .data(bins)
      .enter()
      .append("rect")
      .attr("transform", d => `translate(${scaleX(d.x0)},${scaleY(d.length)})`)
      .attr("x", 1)
      .attr("width", d => d3.max([0, scaleX(d.x1) - scaleX(d.x0) - 1]))
      .attr("height", d => height - scaleY(d.length))
      .attr("fill", "#298e75")
      .attr("fill-opacity", 0.4)
      .text((d, idx, arr) => { //  focus here
        const rect = arr[idx]
        const [x, y, width] = [rect.getAttribute("x"), rect.getAttribute("y") ?? 0, rect.getAttribute("width")];
        if (width > 0) {
          const msg = `${d.x0}~${d.x1}: ${d.length}`
          rect.insertAdjacentHTML("afterend", `
     <foreignobject x="${x}" y="${y}" width="${msg.length * 13}" height=26 display="none" class="tooltip"
     transform="translate(${scaleX(d.x0)},${scaleY(d.length)})">
        <div>${msg}</div>
     </foreignobject>
    `)
        }
        return ""
      })

    /**
     You can certainly consider creating just one element and moving it around to achieve the display effect. [see https://stackoverflow.com/a/47002479/9935654]
     On my side, I made a corresponding element individually, which seems to generate a lot of duplicate items, but it can be done as follows:
     If you are interested in a specific marker, you can click on it, and it will display the message forever(cancel again to hidden)
     * */
    document.querySelectorAll(`foreignObject.tooltip`).forEach(div => { //  focus here
      div.addEventListener("click", () => {
        div.setAttribute("display", div.getAttribute("display") === "none" ? "" : "none")
      })
    })
  }

  demo1PureJS()
  demo2D3js()
  demo3SVGTitle()
  demo4Histogram()

</script>

