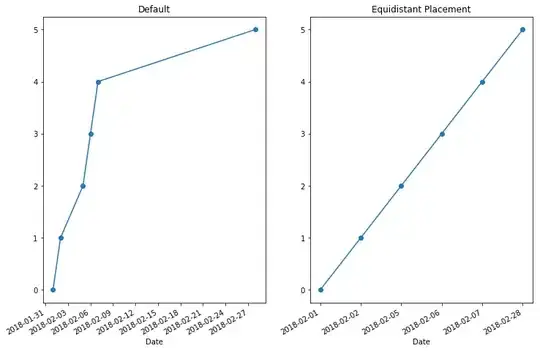
Up to date answer (2018) with Matplotlib 2.1.2, Python 2.7.12
The function equidate_ax handles everything you need for a simple date x-axis with equidistant spacing of data points. Realised with ticker.FuncFormatter based on this example.
from __future__ import division
from matplotlib import pyplot as plt
from matplotlib.ticker import FuncFormatter
import numpy as np
import datetime


def equidate_ax(fig, ax, dates, fmt="%Y-%m-%d", label="Date"):
    """
    Sets all relevant parameters for an equidistant date-x-axis.
    Tick Locators are not affected (set automatically)

    Args:
        fig: pyplot.figure instance
        ax: pyplot.axis instance (target axis)
        dates: iterable of datetime.date or datetime.datetime instances
        fmt: Display format of dates
        label: x-axis label
    Returns:
        None

    """
    N = len(dates)
    def format_date(index, pos):
        index = np.clip(int(index + 0.5), 0, N - 1)
        return dates[index].strftime(fmt)
    ax.xaxis.set_major_formatter(FuncFormatter(format_date))
    ax.set_xlabel(label)
    fig.autofmt_xdate()


#
# Some test data (with python dates)
#
dates = [datetime.datetime(year, month, day) for year, month, day in [
    (2018,2,1), (2018,2,2), (2018,2,5), (2018,2,6), (2018,2,7), (2018,2,28)
]]
y = np.arange(6)


# Create plots. Left plot is default with a gap
fig, [ax1, ax2] = plt.subplots(1, 2)
ax1.plot(dates, y, 'o-')
ax1.set_title("Default")
ax1.set_xlabel("Date")


# Right plot will show equidistant series
# x-axis must be the indices of your dates-list
x = np.arange(len(dates))
ax2.plot(x, y, 'o-')
ax2.set_title("Equidistant Placement")
equidate_ax(fig, ax2, dates)


