Say I have this example data frame
set.seed(12345)
n1 <- 3
n2 <- 10
n3 <- 60

times <- seq(0, 100, 0.5)

individual <- c(rep(1, n1),
                rep(2, n2),
                rep(3, n3))

events <- c(sort(sample(times, n1)),
            sort(sample(times, n2)),
            sort(sample(times, n3)))

df <- data.frame(individual = individual, events = events)
Which gives
> head(df, 10)
   individual events
1           1   72.0
2           1   75.5
3           1   87.5
4           2    3.0
5           2   14.5
6           2   16.5
7           2   32.0
8           2   45.5
9           2   50.0
10          2   70.5
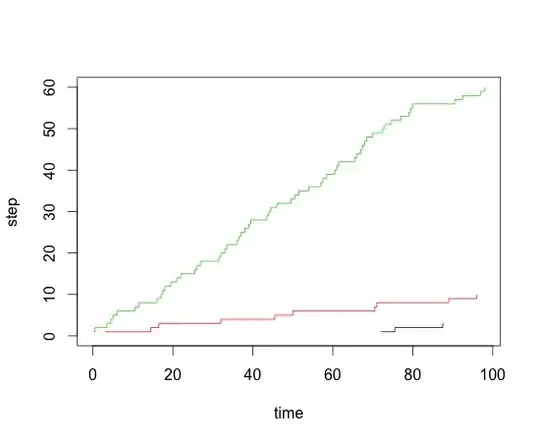
I would like to plot a cumulative step graph of the events so that I get one line per individual which goes up by 1 each time an event is "encountered".
So, for instance individual 1 will be 0 up to 72.0, then go up to 1, until 75.5 when it becomes 2 and up to 3 at 87.5 to the end of the graph.
What would be the easiest way to do that?