Data:
df <- data.frame(
    type   = c("T", "F", "P", "T", "F", "P", "T", "F", "P", "T", "F", "P"),
    size   = c("50%", "50%", "50%", "100%", "100%", "100%", "150%", "150%", "150%", "200%", "200%", "200%"),
    amount = c(48.4, 48.1, 46.8, 25.9, 26, 24.9, 21.1, 21.4, 20.1, 20.8, 21.5, 16.5)
)
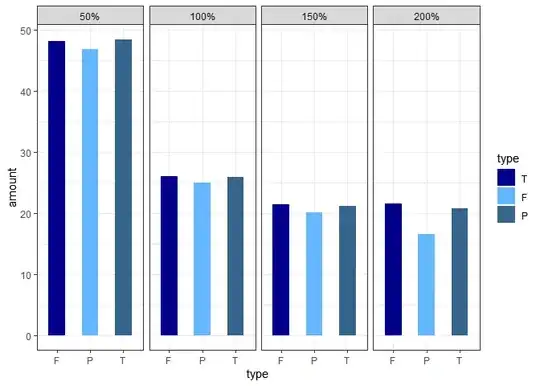
I need to plot a bargraph of the above data using ggplot (x-axis -> type, y-axis -> amount, group by size). When I used the following code, I am not getting the variable type and as well as size in the order shown in the data. Please see the figure. I have used the following code for that.
 ggplot(df, aes(type, amount , fill=type, group=type, shape=type, facets=size)) +
  geom_col(width=0.5, position = position_dodge(width=0.6)) +
  facet_grid(.~size) +
  theme_bw() +
  scale_fill_manual(values = c("darkblue","steelblue1","steelblue4"),
                    labels = c("T", "F", "P"))
 .
.
For fixing the order issue, I have used a factor method for the variable "type" using the following. Please see the figure also.
temp$new = factor(temp$type, levels=c("T","F","P"), labels=c("T","F","P"))
However, now I don't know how to fix the order for the variable size. It should be 50%, 100%. 150%, and 200%.