Jdbaba,
From your comments, you mentioned that you'd like for the geom_point to have just the . in the legend. This is a feature that is yet to be implemented to be used directly in ggplot2 (if I am right). However, there's a fix/work-around that is given by @Aniko in this post. Its a bit tricky but brilliant! And it works great. Here's a version that I tried out. Hope it is what you expected.
# bind both your data.frames
df <- rbind(tempcal, tempobs)

p <- ggplot(data = df, aes(x = time, y = data, colour = group1,
                 linetype = group1, shape = group1))
p <- p + geom_line() + geom_point()
p <- p + scale_shape_manual("", values=c(NA, NA, 19))
p <- p + scale_linetype_manual("", values=c(1,1,0))
p <- p + scale_colour_manual("", values=c("#F0E442", "#0072B2", "#D55E00"))
p <- p + facet_wrap(~ id, ncol = 1)
p
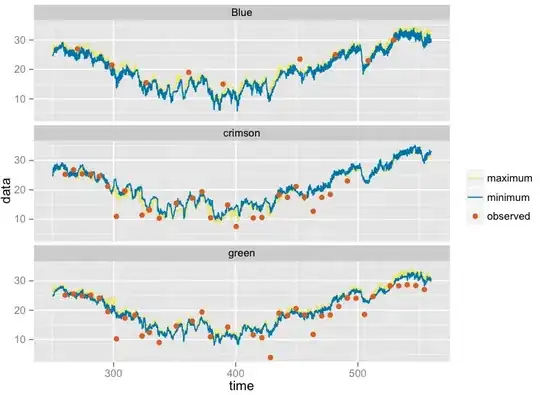
The idea is to first create a plot with all necessary attributes set in the aesthetics section, plot what you want and then change settings manually later using scale_._manual. You can unset lines by a 0 in scale_linetype_manual for example. Similarly you can unset points for lines using NA in scale_shape_manual. Here, the first two values are for group1=maximum and minimum and the last is for observed. So, we set NA to the first two for maximum and minimum and set 0 to linetype for observed.
And this is the plot: