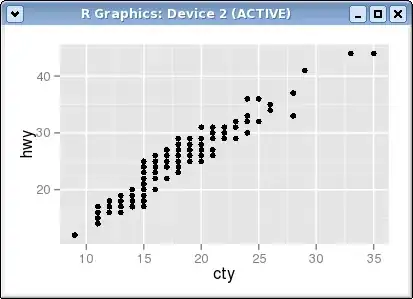
The y-axis title appears too close to the axis text.
ggplot(mpg, aes(cty, hwy)) + geom_point()
I have tried changing the value of many parameters with theme() but none seems to help.
From ggplot2 2.0.0 you can use the margin = argument of element_text() to change the distance between the axis title and the numbers. Set the values of the margin on top, right, bottom, and left side of the element.
ggplot(mpg, aes(cty, hwy)) + geom_point()+
  theme(axis.title.y = element_text(margin = margin(t = 0, r = 20, b = 0, l = 0)))
margin can also be used for other element_text elements (see ?theme), such as axis.text.x, axis.text.y and title.
addition
in order to set the margin for axis titles when the axis has a different position (e.g., with scale_x_...(position = "top"), you'll need a different theme setting - e.g. axis.title.x.top. See https://github.com/tidyverse/ggplot2/issues/4343.
Based on this forum post: https://groups.google.com/forum/#!topic/ggplot2/mK9DR3dKIBU
Sounds like the easiest thing to do is to add a line break (\n) before your x axis, and after your y axis labels. Seems a lot easier (although dumber) than the solutions posted above.
ggplot(mpg, aes(cty, hwy)) +
    geom_point() +
    xlab("\nYour_x_Label") + ylab("Your_y_Label\n")
A solution that offers more fine-grained control than \n but is less cumbersome than adding margins is to use vjust in the theme function.
For adjusting the position on the y-axis or (x-axis) to add space, this often requires using a positive value for vjust (y-axis) or a negative value for vjust (x-axis) as in theme(axis.title.y = element_text(vjust = 2)). See a fully worked example below.
# load patchwork to show plots side-by-side
library(patchwork)
library(ggplot2)

# Plot A: just for comparison, moving titles *inward*
p1 <- ggplot(mpg, aes(cty, hwy)) +
  geom_point() +
  theme_gray() +
  theme(
    axis.title.y = element_text(vjust = -3),
    axis.title.x = element_text(vjust = +3)
  )

# Plot B: what we want, moving titles *outward*
p2 <- ggplot(mpg, aes(cty, hwy)) +
  geom_point() +
  theme_gray() +
  theme(
    axis.title.y = element_text(vjust = +3),
    axis.title.x = element_text(vjust = -0.75)
  )

# show plots side-by-side with patchwork package
p1 + p2 +
  plot_annotation(tag_levels = "A")

For some reason the margin argument suggested by Didzis Elferts did not work for me. So, I used a different hack that is more flexible than adding an empty line but needs giving up the axis ticks.
myplot + theme(axis.ticks.x = element_blank(), axis.ticks.length.x = unit(3.25, "cm")
I guess, one can add the tick marks manually with geom_segment. Another possibility might be [ggalt::annotation_ticks][1]but I didn't bother trying either (note the current version of ggalt on CRAN (0.4) does not support this function, the one on github (0.6) does).