Possible Duplicate:
How to create grouped barplot with R
Species      Dbh   Height
1       DF 383.7143 254.3036
2       ES 403.3333 280.0000
3        F 372.0000 270.0000
4       FG 381.5000 275.0000
5       GF 351.5838 242.6522
6       HW 209.0000 198.0000
7       LP 232.8571 218.3333
8       PP 568.5000 330.0000
9       SF 136.4286 154.1000
10      WC 375.0757 234.8777
11      WL 340.0588 252.5714
12      WP 319.7273 251.3939
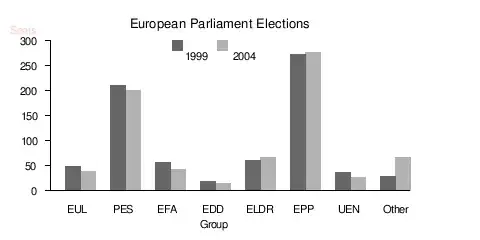
I want to turn the data above into a bar graph like this one. Species as bins and dbh and height as bars for each bin.
I used the code:
aggregate(ufc[,4:5],ufc[3],mean,na.rm=TRUE)
to get the above data set
I can only get one variable at a time using this code:
barplot(ufc.means$Height, col=rainbow(20),
                            names.arg=(ufc.means$Species), las=2,main="Height")