I have a data like this:
data <- data.frame(Comp = factor(rep(2003:2004, each = 8)),
                   Cat = rep(letters[1:4], 4),
                   Type = rep(c('Free','Used'), each = 4),
                   Count = trunc(rnorm(16,30,2)))
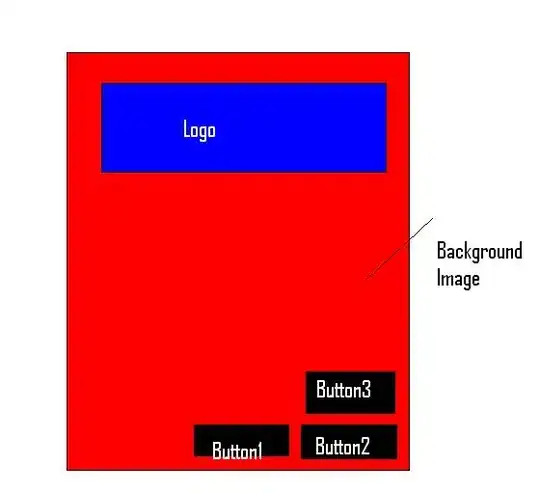
And I need something like a barplot with beside = TRUE and beside = FALSE (TRUE for Cat and Comp, and FALSE = Type).
With this data, it will result a plot with 8 columns (Interaction of Comp with Cat (Comp = 2003 + Cat = A ; Comp = 2003 + Cat = B ; ... ; Comp = 2004 + Cat = D)), each one with 2 stacked columns (the levels of Type (Free and Used)) for Count variable.
Any tip how can I do this kind of plot? I tried to do an example in EXCEL, but I failed on it too.