I'm new to R and have the following challenge;
I want to create a visualization that basically combines 2 kind of 'heatmaps' in order to visualize at what times there are truly dark skies (for astronomy). For this I want to have a heatmap that visualizes the brightness of the moon based on the moonrise and moonset times and the phase of the moon. On this then we can plot a 'band'like heatmap for the time the sun is up with some transparency. I'm not sure if this is going to work visualy or if I need to find some other solution, however this seems like a good challenge to get into R some more. But I could use some pointers as I'm stuck already loading the matrix of size 24(hours) x 31(days) with all the 720 values. When trying to create a basic data.frame from the vectors I get the error that the number of rows are inconsistent.
Furthermore I have some heatmap examples working already, but I'm not sure how to combine 2 of them in the same plot like I described.
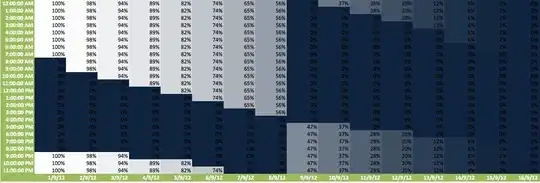
As an illustration the current 'heatmap' as it is in excel
And some data:
MOON
moon <- structure(list(X1.9.12 = structure(c(2L, 2L, 2L, 2L, 2L, 2L,
2L, 2L, 1L, 1L, 1L, 1L, 1L, 1L, 1L, 1L, 1L, 1L, 1L, 1L, 1L, 2L,
2L, 2L), .Label = c("0%", "100%"), class = "factor"), X2.9.12 = structure(c(2L,
2L, 2L, 2L, 2L, 2L, 2L, 2L, 2L, 2L, 1L, 1L, 1L, 1L, 1L, 1L, 1L,
1L, 1L, 1L, 1L, 2L, 2L, 2L), .Label = c("0%", "98%"), class = "factor"),
    X3.9.12 = structure(c(2L, 2L, 2L, 2L, 2L, 2L, 2L, 2L, 2L,
    2L, 2L, 1L, 1L, 1L, 1L, 1L, 1L, 1L, 1L, 1L, 1L, 2L, 2L, 2L
    ), .Label = c("0%", "94%"), class = "factor"), X4.9.12 = structure(c(2L,
    2L, 2L, 2L, 2L, 2L, 2L, 2L, 2L, 2L, 2L, 2L, 1L, 1L, 1L, 1L,
    1L, 1L, 1L, 1L, 1L, 1L, 2L, 2L), .Label = c("0%", "89%"), class = "factor"),
    X5.9.12 = structure(c(2L, 2L, 2L, 2L, 2L, 2L, 2L, 2L, 2L,
    2L, 2L, 2L, 2L, 1L, 1L, 1L, 1L, 1L, 1L, 1L, 1L, 1L, 2L, 2L
    ), .Label = c("0%", "82%"), class = "factor"), X6.9.12 = structure(c(2L,
    2L, 2L, 2L, 2L, 2L, 2L, 2L, 2L, 2L, 2L, 2L, 2L, 2L, 1L, 1L,
    1L, 1L, 1L, 1L, 1L, 1L, 1L, 2L), .Label = c("0%", "74%"), class = "factor"),
    X7.9.12 = structure(c(2L, 2L, 2L, 2L, 2L, 2L, 2L, 2L, 2L,
    2L, 2L, 2L, 2L, 2L, 2L, 1L, 1L, 1L, 1L, 1L, 1L, 1L, 1L, 1L
    ), .Label = c("0%", "65%"), class = "factor"), X8.9.12 = structure(c(2L,
    2L, 2L, 2L, 2L, 2L, 2L, 2L, 2L, 2L, 2L, 2L, 2L, 2L, 2L, 2L,
    1L, 1L, 1L, 1L, 1L, 1L, 1L, 1L), .Label = c("0%", "56%"), class = "factor"),
    X9.9.12 = structure(c(1L, 1L, 1L, 1L, 1L, 1L, 1L, 1L, 1L,
    1L, 1L, 1L, 1L, 1L, 1L, 1L, 1L, 2L, 2L, 2L, 2L, 2L, 2L, 2L
    ), .Label = c("0%", "47%"), class = "factor"), X10.9.12 = structure(c(2L,
    1L, 1L, 1L, 1L, 1L, 1L, 1L, 1L, 1L, 1L, 1L, 1L, 1L, 1L, 1L,
    1L, 2L, 2L, 2L, 2L, 2L, 2L, 2L), .Label = c("0%", "37%"), class = "factor"),
    X11.9.12 = structure(c(2L, 2L, 1L, 1L, 1L, 1L, 1L, 1L, 1L,
    1L, 1L, 1L, 1L, 1L, 1L, 1L, 1L, 1L, 2L, 2L, 2L, 2L, 2L, 2L
    ), .Label = c("0%", "28%"), class = "factor"), X12.9.12 = structure(c(2L,
    2L, 2L, 1L, 1L, 1L, 1L, 1L, 1L, 1L, 1L, 1L, 1L, 1L, 1L, 1L,
    1L, 1L, 2L, 2L, 2L, 2L, 2L, 2L), .Label = c("0%", "20%"), class = "factor"),
    X13.9.12 = structure(c(2L, 2L, 2L, 2L, 1L, 1L, 1L, 1L, 1L,
    1L, 1L, 1L, 1L, 1L, 1L, 1L, 1L, 1L, 1L, 2L, 2L, 2L, 2L, 2L
    ), .Label = c("0%", "12%"), class = "factor"), X14.9.12 = structure(c(2L,
    2L, 2L, 2L, 2L, 2L, 1L, 1L, 1L, 1L, 1L, 1L, 1L, 1L, 1L, 1L,
    1L, 1L, 1L, 2L, 2L, 2L, 2L, 2L), .Label = c("0%", "6%"), class = "factor"),
    X15.9.12 = structure(c(2L, 2L, 2L, 2L, 2L, 2L, 2L, 1L, 1L,
    1L, 1L, 1L, 1L, 1L, 1L, 1L, 1L, 1L, 1L, 1L, 2L, 2L, 2L, 2L
    ), .Label = c("0%", "2%"), class = "factor"), X16.9.12 = structure(c(1L,
    1L, 1L, 1L, 1L, 1L, 1L, 1L, 1L, 1L, 1L, 1L, 1L, 1L, 1L, 1L,
    1L, 1L, 1L, 1L, 1L, 1L, 1L, 1L), .Label = "0%", class = "factor"),
    X17.9.12 = structure(c(2L, 2L, 2L, 2L, 2L, 2L, 2L, 2L, 2L,
    2L, 1L, 1L, 1L, 1L, 1L, 1L, 1L, 1L, 1L, 1L, 2L, 2L, 2L, 2L
    ), .Label = c("0%", "1%"), class = "factor")), .Names = c("X1.9.12",
"X2.9.12", "X3.9.12", "X4.9.12", "X5.9.12", "X6.9.12", "X7.9.12",
"X8.9.12", "X9.9.12", "X10.9.12", "X11.9.12", "X12.9.12", "X13.9.12",
"X14.9.12", "X15.9.12", "X16.9.12", "X17.9.12"), class = "data.frame", row.names = c("0:00:00",
"1:00:00", "2:00:00", "3:00:00", "4:00:00", "5:00:00", "6:00:00",
"7:00:00", "8:00:00", "9:00:00", "10:00:00", "11:00:00", "12:00:00",
"13:00:00", "14:00:00", "15:00:00", "16:00:00", "17:00:00", "18:00:00",
"19:00:00", "20:00:00", "21:00:00", "22:00:00", "23:00:00"))
SUN
    September
Day Sunrise Sunset
1   6:52    20:26
2   6:54    20:24
3   6:56    20:22
4   6:57    20:20
5   6:59    20:17
6   7:00    20:15
7   7:02    20:13
8   7:04    20:10
9   7:05    20:08
10  7:07    20:06
11  7:08    20:05
12  7:09    20:02
13  7:11    20:00
14  7:13    19:58
15  7:14    19:55
16  7:16    19:53
17  7:17    19:51
18  7:19    19:48
19  7:21    19:46
20  7:22    19:44
21  7:25    19:40
22  7:26    19:38
23  7:28    19:35
24  7:30    19:33
25  7:31    19:31
26  7:33    19:28
27  7:35    19:26
28  7:36    19:24
29  7:38    19:21
30  7:40    19:19