Doing this requires thinking about how barplot draws stacked bars. Basically, you need to feed it some data with 0 values in appropriate places. With your data:
mydat <- cbind(rbind(a,b,0),rbind(0,0,c))[,c(1,6,2,7,3,8,4,9,5,10)]
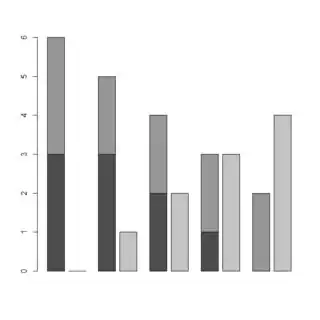
barplot(mydat,space=c(.75,.25))
To see what's going on under the hood, take a look at mydat:
> mydat
  [,1] [,2] [,3] [,4] [,5] [,6] [,7] [,8] [,9] [,10]
a    3    0    3    0    2    0    1    0    0     0
b    3    0    2    0    2    0    2    0    2     0
     0    0    0    1    0    2    0    3    0     4
Here, you're plotting each bar with three values (the value of a, the value of b, the value of c). Each column of the mydat matrix is a bar, sorted so that the ab bars are appropriately interspersed with the c bars. You may want to play around with spacing and color.
Apparently versions of this have been discussed on R-help various times without great solutions, so hopefully this is helpful.
