I got it to work with a bit of a hack;
plot1 <- ggplot(newdatahistogram, aes_string(x=newdatahistogram[RawLocation], fill=(newdatahistogram[,"PQ"]))) +
xlab(GGVar) + ylab("Proportion of Observation") +
geom_histogram(aes(y=..density..), binwidth=1, colour="black", origin=-0.5) +
scale_x_continuous(limits=c(-1,6), breaks=seq(0,5,by=1), expand=c(.01,0)) +
scale_y_continuous(limits=c(-.2,1), breaks=seq(0,1,by=.2))
theme(plot.margin = unit(c(0,0,0,0), "cm"))
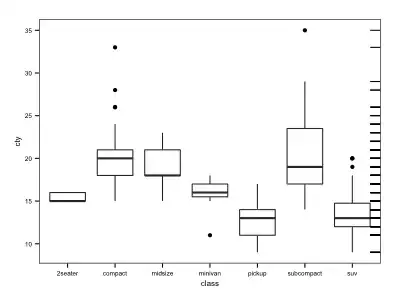
plot_box <- ggplot(newdatahistogram) +
geom_boxplot(aes_string(x=1, y=newdatahistogram[RawLocation])) +
scale_y_continuous(breaks=(0:5), labels=NULL, limits=c(-1,6), expand=c(.0,-.03)) +
scale_x_continuous(breaks=NULL) + xlab(NULL) + ylab(NULL) +
coord_flip() + theme_bw() +
theme(plot.margin = unit(c(0,0,.0,0), "cm"),
line=element_blank(),text=element_blank(),
axis.line = element_blank(),title=element_blank(), panel.border=theme_blank())
PB = ggplotGrob(plot_box)
plot1 <- plot1 + annotation_custom(grob=PB, xmin=-1.01, xmax=5.95, ymin=-.3,ymax=0)
This saves the rotated boxplot as a grob object and inserts it into the plot under the histogram.
I needed to play with the expansion element a bit to get the scales to line up,
but it works!
Seriously though, I think ggplot should have a horizontal boxplot available without cord_flip()... I tried to edit the boxplot code, but it was way too difficult for me!
Tried to post image, but not enough reputation