I realize this answer is six years too late, but it might help someone else.
Given a linear scale whose values range from x0 to x1, and a logarithmic scale whose values range from y0 to y1, the mapping between x and y (in either direction) is given by the relationship shown in equation 1:
 x - x0    log(y) - log(y0)
------- = -----------------      (1)
x1 - x0   log(y1) - log(y0)
where,
x0 < x1
{ x | x0 <= x <= x1 }

y0 < y1
{ y | y0 <= y <= y1 }
y1/y0 != 1   ; i.e., log(y1) - log(y0) != 0
y0, y1, y != 0
EXAMPLE 1
The values on the linear x-axis range from 10 to 12, and the values on the logarithmic y-axis range from 300 to 3000. Given y=1000, what is x?
Rearranging equation 1 to solve for 'x' yields,
                 log(y) - log(y0)
x = (x1 - x0) * ----------------- + x0
                log(y1) - log(y0)

                log(1000) - log(300)
  = (12 - 10) * -------------------- + 10
                log(3000) - log(300)

  ≈ 11
EXAMPLE 2
Given the values in your question, the values on the linear x-axis range from 0.1 to 10, and the values on the logarithmic y-axis range from 0.1 to 10, and the log base is 10. Given x=7.5, what is y?
Rearranging equation 1 to solve for 'y' yields,
          x - x0
log(y) = ------- * (log(y1) - log(y0)) + log(y0)
         x1 - x0

        /  x - x0                                \
y = 10^|  ------- * (log(y1) - log(y0)) + log(y0) |
        \ x1 - x0                                /

        / 7.5 - 0.1                                  \
  = 10^|  --------- * (log(10) - log(0.1)) + log(0.1) |
        \  10 - 0.1                                  /

        / 7.5 - 0.1                    \
  = 10^|  --------- * (1 - (-1)) + (-1) |
        \  10 - 0.1                    /

  ≈ 3.13
:: EDIT (11 Oct 2020) ::
For what it's worth, the number base 'n' can be any real-valued positive number. The examples above use logarithm base 10, but the logarithm base could be 2, 13, e, pi, etc. Here's a spreadsheet I created that performs the calculations for any real-valued positive number base. The "solution" cells are colored yellow and have thick borders. In these figures, I picked at random the logarithm base n=13—i.e., z = log13(y).

Figure 1. Spreadsheet values.

Figure 2. Spreadsheet formulas.
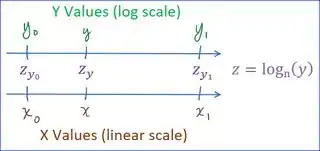
Figure 3. Mapping of X and Y values.


