I want to arrange several ggplot2-plots. It works perfectly fine for histograms, with this code:
df<-NULL
df$Temp<-rnorm(mean=20,sd=3,n=100)
df$Modul<-rep(seq(1,4,1),25)
df<-as.data.frame(df)

qplot(Temp, data=df, geom="histogram",binwidth=1)+
    facet_grid(Modul ~ .)

Now that I want cumulative histograms, I followed this recipy. But it gives me wrong sums:
qplot(Temp, data=df, geom="histogram",binwidth=1)+
geom_histogram(aes(y=cumsum(..count..)),binwidth=1)+
facet_grid(Modul ~ .)
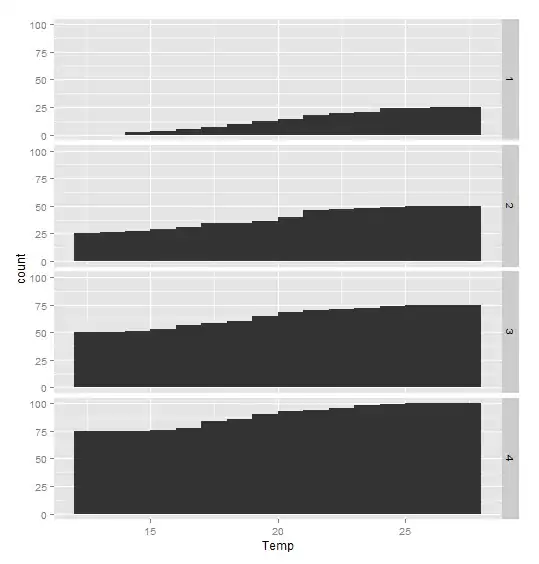
Although I roughly understand what is happening, I am not expert enough to solve this. Any hints?
Best regards, Jochen