I've built a website that gets data from mysql database and displays them with Highcharts. The problem is that in Chrome and Opera the charts work fine but in firefox i can't get the print of the values on the chart!
This is what i get with Crome and Opera....
and this is what i get with firefox....
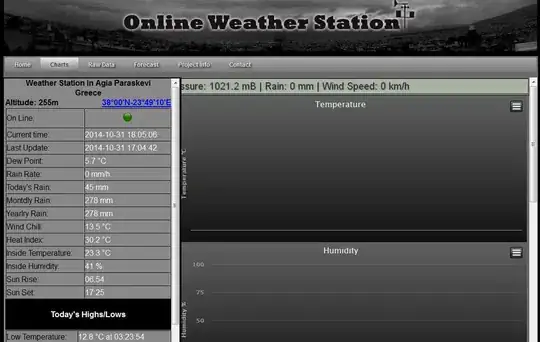
I suppose that the problem may be in the php script that gets the data from the database or not.. i really cant understand why is this happening.. Below i provide the creation code of one of the charts and the php script that gets the data....
The necessary libraries:
 <script type="text/javascript" src="http://code.jquery.com/jquery-1.8.3.min.js"></script>
 <script src="http://code.highcharts.com/highcharts.js"></script>
 <script src="http://code.highcharts.com/modules/exporting.js"></script>
 <script src="http://code.highcharts.com/themes/gray.js"></script>
Highchart Creation Code:
 <script type="text/javascript">
var chart;
        $(document).ready(function() {
            var options = {
                chart: {
                    renderTo: 'container1',
                    defaultSeriesType: 'area',
                    marginRight: 10,
                    marginBottom: 25,
                    zoomType: 'xy'  //zoom
                },
                 credits: {
                    enabled: false
                            },

                title: {
                    text: 'Temperature',
                    x: -20 //center
                },
                subtitle: {
                    text: '',
                    x: -20
                },
                xAxis: {
                    type: 'datetime',
                    //tickInterval:  4 * 24 * 3600 * 1000 , // one hour
                     //minRange: 14 * 24 * 3600000,
                    minRange: 4 * 24 * 3600 * 1000,
                    tickWidth: 0,
                    gridLineWidth: 2,
                    /*labels: {
                        align: 'center',
                        x: -3,
                        y: 20,
                        formatter: function() {
                            return Highcharts.dateFormat('%b %e', this.value);
                        }
                    }*/
                },
                yAxis: {
                    title: {
                        text: 'Temperature °C',
                        lineColor: '#FF0000',
                        lineWidth: 1,


                    },
                    min: null, // Will for min and max to adjust when you zoom
                    max: null, //
                    startOnTick: false,
                    minTickInterval: 1,
                    showFirstLabel: false

                    /*plotLines: [{
                        value: 0,
                        width: 0,
                        color: 'green'
                    }]*/
                },
                tooltip: {
                valueDecimals: 2
                    //formatter: function() {
                          //  return Highcharts.dateFormat('%b %e', this.x-(1000*3600)) +'-'+ Highcharts.dateFormat('%l%p', this.x) +': <b>'+ this.y + '</b>';
                    //}

                },


                legend: {
                    layout: 'vertical',
                    align: 'right',
                    verticalAlign: 'top',
                    x: -10,
                    y: 100,
                    borderWidth: 0
                },

            plotOptions: {
                        series: {
                            marker: {
                                radius: 1
                                    }
                                    }
                             },

                series : [{
                type: 'area',
                name : 'Temperature °C',
                color: '#0099FF',
                fillOpacity: 0.3,
                showInLegend: false,


        }]
            }
            // Load data asynchronously using jQuery. On success, add the data
            // to the options and initiate the chart.
            // This data is obtained by exporting a GA custom report to TSV.
            // http://api.jquery.com/jQuery.get/
            jQuery.get('php_scripts/data.php', null, function(tsv) {
                var lines = [];
                traffic = [];
                try {
                    // split the data return into lines and parse them
                    tsv = tsv.split(/\n/g);
                    jQuery.each(tsv, function(i, line) {
                        line = line.split(/,/);
                        date = Date.parse(line[0] +' UTC');
                        traffic.push([
                            date,
                            parseInt(line[4].replace(',', ''), 10)
                        ]);
                    });
                } catch (e) {  }
                options.series[0].data = traffic;
                chart = new Highcharts.Chart(options);
            });
        });
Part of the html table that displays the chart:
<td><div id="container1" style="width: 725px; height: 300px;"></div></td>
The php script tha gets the data:
<?php
$con = mysql_connect("db4free.net","username","password");

if (!$con) {
die('Could not connect: ' . mysql_error());
}

mysql_select_db("weatherlog", $con);

$result = mysql_query("SELECT * FROM weatherlog");

while($row = mysql_fetch_array($result)) {

echo $row['TIME'] . " , " . $row['TEMP']. " , " . $row['HUMIDITY'] . " , " . $row['PRESSURE'] . "        , " . $row['OUTTEMP'] . " , " . $row['OUTHUMIDITY'] . " , " . $row['RAIN'] . " , " .    $row['WINDSPEED'] . "\n";

}

mysql_close($con);
?>
So?? What should i do?? its very important to run in firefox too..
This is what i get from firefox's console... I have 7 charts that call the data.php and get back 300kb