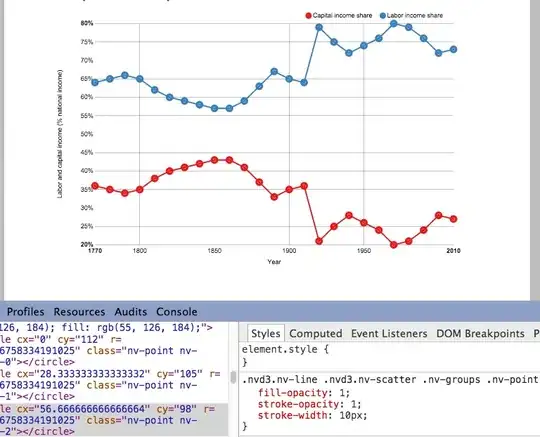
I created an nvd3 type graph with the rCharts package. I saved it in a standalone html and am importing it into an rmarkdown document with <iframe src = 'Figure.html'>.

I looked at the html source in Chrome and Firefox via the 'inspect element' feature and found that the following edits to the css:
.nvd3.nv-line .nvd3.nv-scatter .nv-groups .nv-point {
    stroke-width: 10px;
    fill-opacity: 1;
    stroke-opacity: 1;
}
gives:

which is the effect I want to obtain. However, if I insert the above code into the css, it is not 'picked up'. Other stylings are picked up, so the css is being read, but the above seems to be discarded. Any ideas?
The html figure is here: https://gist.github.com/anonymous/b187e77d795e5bf96f51
EDIT Cracked this one thanks to jbaums and a hint by sal niro. Here's the workflow to transform an rCharts nPlot with 'lineChart' into a combination of 'lineChart' and 'scatterChart'. This is the relevant part of your rmarkdown code:
 ```{r 'Figure'}
require(rCharts)
load("data/df.Rda")
# round data for rChart tooltip display
df$value <- round(df$value, 2)
n <- nPlot(value ~ Year, group = 'variable', data = df, type = 'lineChart')
n$yAxis(axisLabel = 'Labor and capital income (% national income)')
n$chart(margin = list(left = 100)) # margin makes room for label
n$yAxis(tickFormat = "#! function(d) {return Math.round(d*100*100)/100 + '%'} !#")
n$xAxis(axisLabel = 'Year')
n$chart(useInteractiveGuideline=TRUE)
n$chart(color = colorPalette)
n$addParams(height = 500, width = 800)
n$setTemplate(afterScript = '<style>
  .nv-point {
    stroke-opacity: 1!important;
    stroke-width: 6px!important;
    fill-opacity: 1!important;
  }
</style>'
)
n$save('figures/Figure.html', standalone = TRUE)
```

