I used
biplot(prcomp(data, scale.=T), xlabs=rep("·", nrow(data)))
but it did not work to omit the labels.
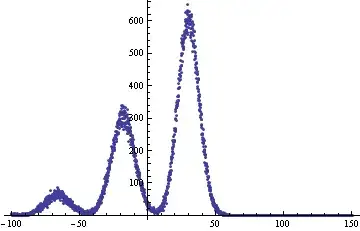
Even if I remove the labels my plot is so messy and ugly which can be seen below!
I also need to show the percentage of PCs on axes

I used the following command to plot the image
biplot(prcomp(data, scale.=T), xlabs=rep("·", nrow(data)), ylabs = rep("·", ncol(data)))
