I want to restrict the visible y-range of my plot. In order to retain values that fall outside this range I need to set oob (out of bounds) to rescale_none and this works well.
However I would also like to add some text in the margins outside the plot. In order to do this I need to turn off clipping. This has the effect that values that are out-of-bounds are plotted outside the plot area in the margins.
Is there anyway to plot text in margins and clip values to plot region?
# Data
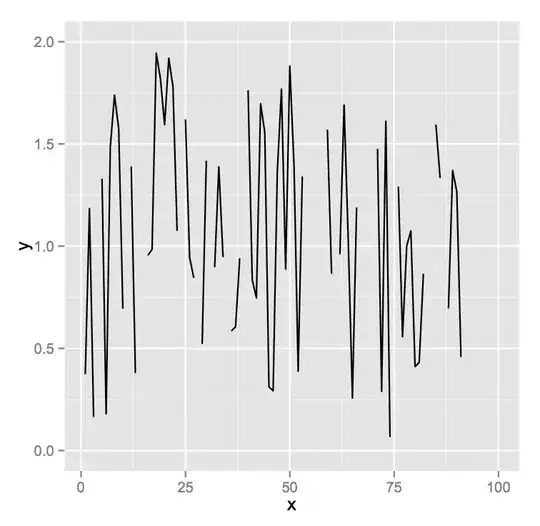
set.seed(1)
df <- data.frame( x=1:100,y=rnorm(100,mean=1,sd=1) )
# Basic plot
library(ggplot2)
library(scales)
library(grid)
g <- ggplot(df)+
geom_line(aes(x,y))
# Values exceeding scale limits are dropped
g1 <- g + scale_y_continuous( limits = c(0,2) )
#  This is what I want
g2 <- g + scale_y_continuous( limits = c(0,2) , oob = rescale_none )

#  ...But, I would like to plot some text outside the plotting region
#  and need to turn off clipping to get the text to display...
g3 <- g + scale_y_continuous( limits = c(0,2) , oob = rescale_none ) +
    # Some text to sit above the plot
    geom_text( aes(label = "Nonsense", y = Inf, x = 0), hjust = 0, vjust = -1) +
    # Add some space for the text
    theme(plot.margin = unit(c(2,1,1,1), "lines"))

#  Turning off clipping makes geom_line also go outside plot area...
#  See here for clipping... http://stackoverflow.com/a/12417481/1478381
g4 <- ggplot_gtable(ggplot_build(g3))
g4$layout$clip[g4$layout$name == "panel"] <- "off"

grid.draw(g4)