Check out the second answer to your linked question. If you discretize your colourmap before calling scatter, it will automatically work as you want it to:
import numpy as np
import matplotlib.pyplot as plt
import matplotlib.cm as cm

n = 14
X = np.random.rand(20)
Y = np.random.rand(20)
Z = np.random.randint(low=0,high=n,size=X.shape)

plt.figure()
plt.scatter(X,Y,c=Z,cmap=cm.hot)
plt.colorbar()

plt.figure()
plt.scatter(X,Y,c=Z,cmap=cm.get_cmap('hot',n))
plt.colorbar()
Results for comparison:

Note that the default colourmap is jet. But only until viridis kicks in starting from version 2.0 as the new (and wonderful) default.
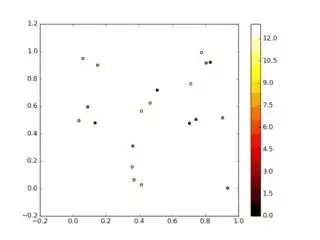
If what's bothering you is that the numbers are floating-point on the colourbar, you can set manual ticks in it, irrespective of the discretization of colours:
plt.figure()
plt.scatter(X,Y,c=Z,cmap=cm.jet)
plt.colorbar(ticks=np.unique(Z))
#or
#plt.colorbar(ticks=range(Z.min(),Z.max()+1))
Result:

Note that since I used a few random-generated points, not every number is present in Z, so unique might not be the best approach (see the missing ticks in the above figure). This is why I also added a solution based on min/max. You can tailor the limits to your needs depending on your actual application.


