I use the following function to transform xts objects into a format that ggplot2 can work with:
xts_to_dataframe = function(..., xts_ids) {
  xts_list = list(...)
  all_include_stop_time = all(sapply(xts_list, function(x) return(!is.null(attr(x, 'stop_timestamps')))))
  names_null = sapply(xts_list, function(x) is.null(names(x)))
  if (any(names_null)) stop('Some xts objects do not have a valid `names` attribute.')
  data_frame_list = lapply(xts_list, function(xts_obj) {
    xts_vars = lapply(names(xts_obj), function(xts_variable) {
      output = data.frame(timestamps = index(xts_obj[,xts_variable]),
                          values = as.vector(xts_obj[,xts_variable]))
      if (all_include_stop_time) {
        output = cbind(output, stop_timestamps = attr(xts_obj, 'stop_timestamps'))
      }
      return(output)
    })
    combined_data_frame = do.call('rbind', xts_vars)
    rownames(combined_data_frame) = NULL
    combined_data_frame[['variable']] = rep(names(xts_obj), sapply(xts_vars, nrow))
    return(combined_data_frame)
  })
  combined_data_frame_list = do.call('rbind', data_frame_list)
  if (missing(xts_ids)) xts_ids = seq_along(data_frame_list)
  combined_data_frame_list[['xts_obj_id']] = rep(xts_ids, sapply(data_frame_list, nrow))
  return(combined_data_frame_list)
}
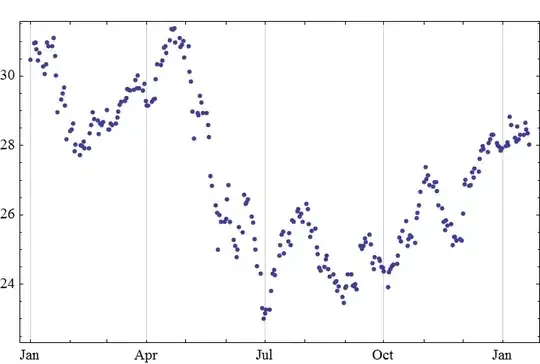
Just feed it a bunch of xts objects, and the resulting data.frame can be plotted using ggplot2. For example:
ggplot(plot_data, aes(x = timestamps, y = values, color = xts_obj_id)) + geom_point()
