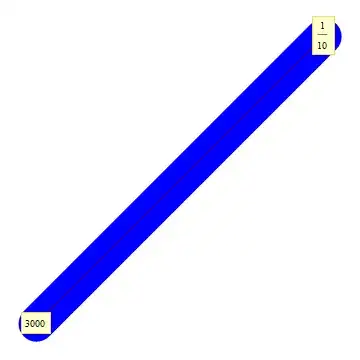
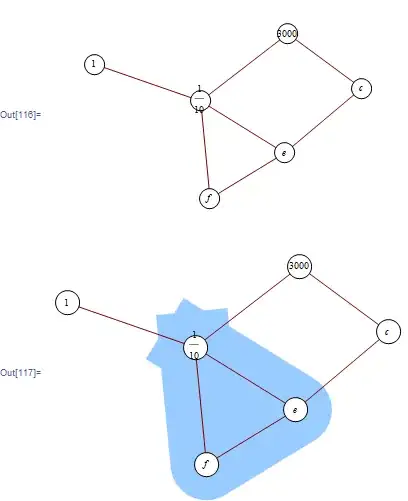
I'd like to programmatically create diagrams like this

(source: yaroslavvb.com)
I imagine I should use GraphPlot with VertexCoordinateRules, VertexRenderingFunction and EdgeRenderingFunction for the graphs. What should I use for colored beveled backgrounds?
Edit Using mainly Simon's ideas, here's a simplified "less robust" version I ended up using
Needs["GraphUtilities`"];
GraphPlotHighlight[edges_, verts_, color_] := Module[{},
  vpos = Position[VertexList[edges], Alternatives @@ verts];
  coords = Extract[GraphCoordinates[edges], vpos];
  (* add .002 because end-cap disappears when segments are almost colinear *)
  AppendTo[coords, First[coords] + .002];
  Show[Graphics[{color, CapForm["Round"], JoinForm["Round"],
     Thickness[.2], Line[coords], Polygon[coords]}],
   GraphPlot[edges], ImageSize -> 150]
  ]

SetOptions[GraphPlot,
  VertexRenderingFunction -> ({White, EdgeForm[Black], Disk[#, .15],
      Black, Text[#2, #1]} &),
  EdgeRenderingFunction -> ({Black, Line[#]} &)];
edges = GraphData[{"Grid", {3, 3}}, "EdgeRules"];
colors = {LightBlue, LightGreen, LightRed, LightMagenta};
vsets = {{8, 5, 2}, {7, 5, 8}, {9, 6, 3}, {8, 1, 2}};
MapThread[GraphPlotHighlight[edges, #1, #2] &, {vsets, colors}]

(source: yaroslavvb.com)


