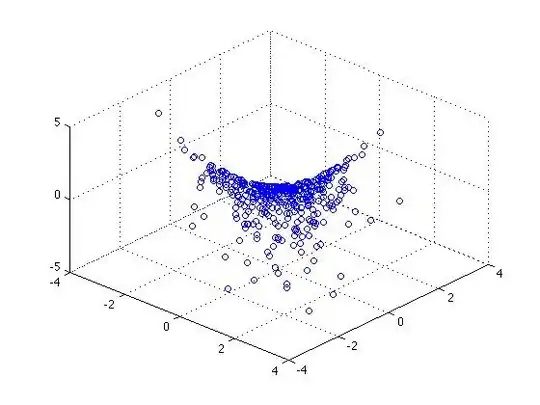
I have a 2 Dimensional input data; a set of vector with 2 components, let's say 200. And for each one of those I have a scalar value given to them.
So it's basically something like this:
{ [input1(i) input2(i)] , output(i) } where i goes from 1 to 200
I would like to make a 3 Dimensional plot with this data, but I don't know how exactly.
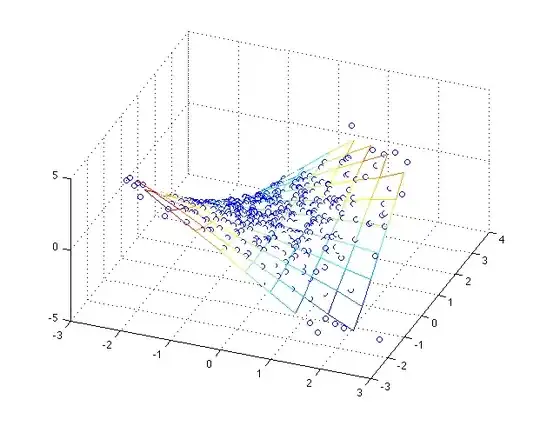
I have tried with surf. I have done a meshgrid with the input value, but I don't know how to obtain a matrix out of the output data in order to do a surf.
How can I get a 3 Dimensional plot with this data?