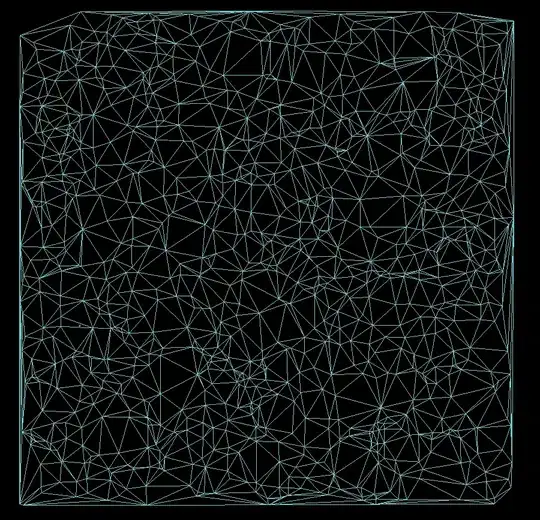
I want to plot candlestick and 5-days average line on the same qchart, it should show one x axis, but gives two x axis. here is the code and the plot.
import sys
from PyQt5.QtChart import (QCandlestickSeries, QChart, QChartView)
from PyQt5.QtWidgets import QApplication, QMainWindow
from PyQt5.QtCore import Qt
from PyQt5 import QtChart as qc

"""
data to be load just like the following:

num, open, high, low, close, ma5
1    7380  7520  7380 7510   7324
2    7520  7580  7410 7440   7372
3    7440  7650  7310 7520   7434
4    7450  7640  7450 7550   7480
5    7510  7590  7460 7490   7502
6    7500  7590  7480 7560   7512
7    7560  7830  7540 7800   7584
... ...
"""

app = QApplication(sys.argv)
#
series = QCandlestickSeries()
series.setDncreasingColor(Qt.red)
series.setIecreasingColor(Qt.green)

ma5 = qc.QLineSeries()  # 5-days average data line
candle_x_axis_label = []  # stores str type data

# in a loop,  series and ma5 append corresponding data
for num, o, h, l, c, m in data:
    series.append(QCandlestickSet(o, h, l, c))
    ma5.append(m)
    candle_x_axis_label.append(str(num))

chart = QChart()

chart.addSeries(series)  # candle
chart.addSeries(ma5)  # ma5 line

chart.setAnimationOptions(QChart.SeriesAnimations)
chart.createDefaultAxes()
chart.legend().hide()

# here is the point
# tm is str list, just like '1, 2, 3, ..., n'
chart.axes(Qt.Horizontal)[0].setCategories(candle_x_axis_label)

#
chartview = QChartView(chart)
ui = QMainWindow()
ui.setGeometry(50, 50, 500, 300)
ui.setCentralWidget(chartview)
ui.show()
sys.exit(app.exec_())
i check qtchart code, and find out the class type of candlestick x axis is QBarCategoryAxis but the class type of ma5 x axis is QValueAxis. so how to remove of the two x axis?

