Sorry in advance the number of images, but they help demonstrate the issue
I have built a dataframe which contains film thickness measurements, for a number of substrates, for a number of layers, as function of coordinates:
|    | Sub | Result | Layer | Row | Col |
|----|-----|--------|-------|-----|-----|
|  0 |   1 |   2.95 | 3 - H |   0 |  72 |
|  1 |   1 |   2.97 | 3 - V |   0 |  72 |
|  2 |   1 |   0.96 | 1 - H |   0 |  72 |
|  3 |   1 |   3.03 | 3 - H | -42 |  48 |
|  4 |   1 |   3.04 | 3 - V | -42 |  48 |
|  5 |   1 |   1.06 | 1 - H | -42 |  48 |
|  6 |   1 |   3.06 | 3 - H |  42 |  48 |
|  7 |   1 |   3.09 | 3 - V |  42 |  48 |
|  8 |   1 |   1.38 | 1 - H |  42 |  48 |
|  9 |   1 |   3.05 | 3 - H | -21 |  24 |
| 10 |   1 |   3.08 | 3 - V | -21 |  24 |
| 11 |   1 |   1.07 | 1 - H | -21 |  24 |
| 12 |   1 |   3.06 | 3 - H |  21 |  24 |
| 13 |   1 |   3.09 | 3 - V |  21 |  24 |
| 14 |   1 |   1.05 | 1 - H |  21 |  24 |
| 15 |   1 |   3.01 | 3 - H | -63 |   0 |
| 16 |   1 |   3.02 | 3 - V | -63 |   0 |
and this continues for >10 subs (per batch), and 13 sites per sub, and for 3 layers - this df is a composite.
I am attempting to present the data as a facetgrid of heatmaps (adapting code from How to make heatmap square in Seaborn FacetGrid - thanks!)
I can plot a subset of the df quite happily:
spam = df.loc[df.Sub== 6].loc[df.Layer == '3 - H']
spam_p= spam.pivot(index='Row', columns='Col', values='Result')

sns.heatmap(spam_p, cmap="plasma")
BUT - there are some missing results, where the layer measurement errors (returns '10000') so I've replaced these with NaNs:
df.Result.replace(10000, np.nan)
To plot a facetgrid to show all subs/layers, I've written the following code:
def draw_heatmap(*args, **kwargs):
    data = kwargs.pop('data')
    d = data.pivot(columns=args[0], index=args[1],
    values=args[2])
    sns.heatmap(d, **kwargs)

fig = sns.FacetGrid(spam, row='Wafer',
col='Feature', height=5, aspect=1)

fig.map_dataframe(draw_heatmap, 'Col', 'Row', 'Result', cbar=False, cmap="plasma", annot=True, annot_kws={"size": 20})
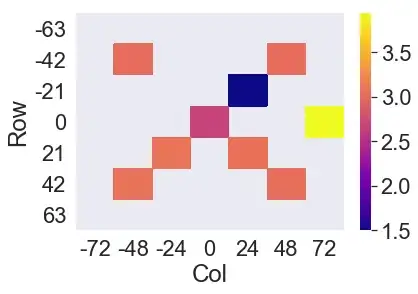
which yields:
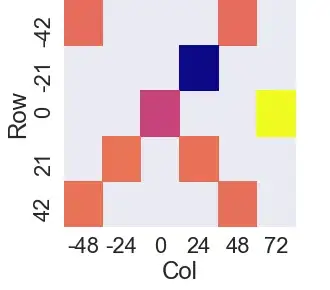
It has automatically adjusted axes to not show any positions where there is a NaN.
I have tried masking (see https://github.com/mwaskom/seaborn/issues/375) but just errors out with Inconsistent shape between the condition and the input (got (237, 15) and (7, 7)).
And the result of this is, when not using the cropped down dataset (i.e. df instead of spam, the code generates the following Facetgrid):
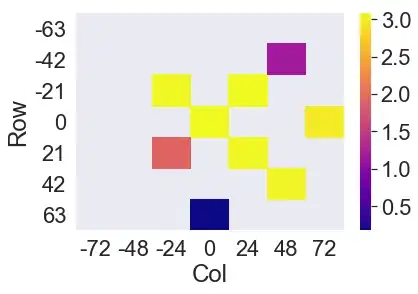
Plots featuring missing values at extreme (edge) coordinate positions make the plot shift within the axes - here all apparently to the upper left. Sub #5, layer 3-H should look like:
i.e. blanks in the places where there are NaNs.
Why is the facetgrid shifting the entire plot up and/or left? The alternative is dynamically generating subplots based on a sub/layer-count (ugh!).
Any help very gratefully received.
Full dataset for 2 layers of sub 5:
    Sub Result  Layer   Row     Col
0   5   2.987   3 - H   0       72
1   5   0.001   1 - H   0       72
2   5   1.184   3 - H   -42     48
3   5   1.023   1 - H   -42     48
4   5   3.045   3 - H   42      48
5   5   0.282   1 - H   42      48
6   5   3.083   3 - H   -21     24
7   5   0.34    1 - H   -21     24
8   5   3.07    3 - H   21      24
9   5   0.41    1 - H   21      24
10  5   NaN     3 - H   -63     0
11  5   NaN     1 - H   -63     0
12  5   3.086   3 - H   0       0
13  5   0.309   1 - H   0       0
14  5   0.179   3 - H   63      0
15  5   0.455   1 - H   63      0
16  5   3.067   3 - H   -21    -24
17  5   0.136   1 - H   -21    -24
18  5   1.907   3 - H   21     -24
19  5   1.018   1 - H   21     -24
20  5   NaN     3 - H   -42    -48
21  5   NaN     1 - H   -42    -48
22  5   NaN     3 - H   42     -48
23  5   NaN     1 - H   42     -48
24  5   NaN     3 - H   0      -72
25  5   NaN     1 - H   0      -72


