You could always make your own function to do this ;I make such functions on a regular basis when nothing really fits my needs.
I put this together rather quickly but you can adapt it to your needs.
# generate data
set.seed(6)
n <- 50
dat <- data.frame(x1=seq(1,100, length.out = n),
                  x2=seq(1,20, length.out = n)+rnorm(n),
                  x3=seq(1,20, length.out = n)+rnorm(n, mean = 3),
                  x4=seq(1,20, length.out = n)+rnorm(n, mean = 5))
# make some NAs at the end
dat[45:n,2] <- NA
dat[30:n,3] <- NA


plot_multi <- function(df, x=1, y=2, cols=y,
                       xlim=range(df[,x], na.rm = T),
                       ylim=range(df[,y], na.rm = T),
                       main="", xlab="", ylab="", ...){
  # setup plot frame
  plot(NULL,
       xlim=xlim,
       ylim=ylim,
       main=main, xlab=xlab, ylab=ylab)

  # plot all your y's against your x
  pb <- sapply(seq_along(y), function(i){
    points(df[,c(x, y[i])], col=cols[i], ...)
  })
}

plot_multi(dat, y=2:4, type='l', lwd=3, main = ":)",
           xlab = "Wavelength", ylab = "Absorbance")
Results in :

EDIT
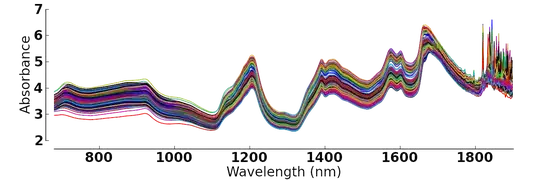
I actually found your dataset online by chance, so I'll include how to plot it as well using my code above.
file <- 'http://openmv.net/file/tablet-spectra.csv'
spectra <- read.csv(file, header = FALSE)

# remove box label
spectra <- spectra[,-1]

# add the 'wavelength' and rotate the df
# (i didn't find the actual wavelength values, but hey).
spectra <- cbind(1:ncol(spectra), t(spectra))

plot_multi(spectra, y=2:ncol(spectra), cols = rainbow(ncol(spectra)),
           type='l', main=":))", ylab="Absorbance", xlab = "'Wavelength'")


