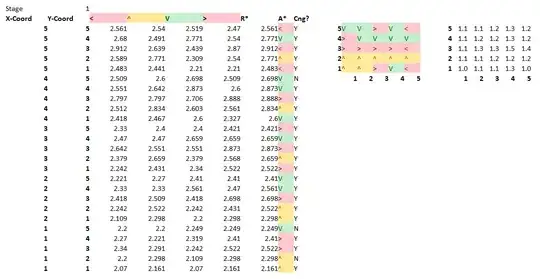
I was plotting some certain surfaces with matplotlib contouring. There I have noticed some interesting patterns. The same colors having different values among different plots. For example, consider the following two images. In the first image, the red color has value 3.0, but in the second image, the value 3.0 is quite pale red. Is there any method available to make the colors coherent by making certain colors represent a perticular range of values.
Asked
Active
Viewed 24 times

