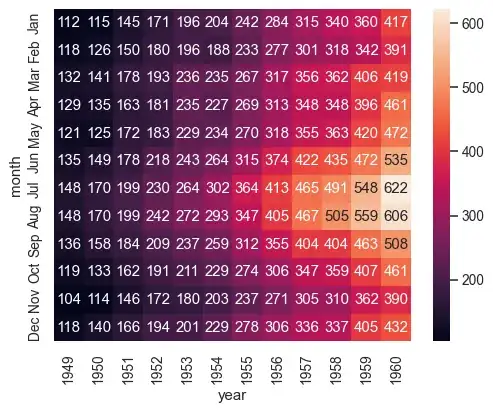
I'm trying to plot a sns.heatmap() of a list of projects, based on the performance of the projects. Something like that:
My current dataset looks like this:
            Project  Performance
Date
2019-03-01        A         37.5
2019-03-01        B        100.0
2019-03-01        C          0.0
2019-03-02        A         99.0
2019-03-02        B         95.0
2019-03-02        C         97.0
I'm trying to convert it to the following format:
                  A      B      C
Date
2019-03-01     37.5  100.0    0.0
2019-03-02     99.0   95.0   97.0
I was wondering if I can easily convert my format, but I didn't find an answer.
I'd appreciate any assistance. Thanks in advance.