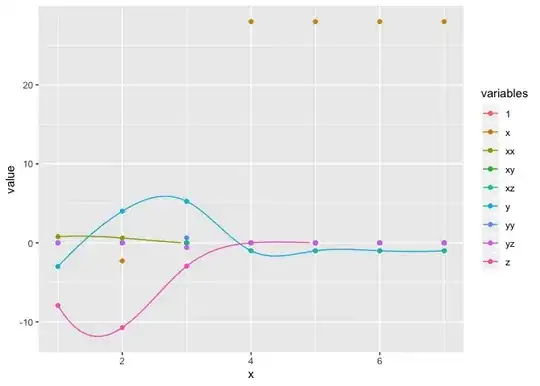
I currently have the below plot in R. I was wondering if it was possible to end the curves once they hit zero. For example, once z hits zero is it possible to remove the line and points on the plot after 10^4?

ydot.dplyr <- ydot.n0 %>% select(variables, variable, value) %>%
                group_by(variables) %>%
                do(as.data.frame(spline(x= .[["variable"]], y= .[["value"]], n = nrow(.)*10)))


ggplot(ydot.n0, aes(variable, value)) +
   geom_point(aes(colour = factor(variables))) +
   geom_line(data = ydot.dplyr, aes(x = x, y = y, colour = factor(variables)))

   variables variable        value
1          1     10^2   0.00000000
2          x     10^2   0.00000000
3          y     10^2  -2.98409634
4          z     10^2  -7.92656901
5         xx     10^2   0.78848436
6         xy     10^2   0.00000000
7         xz     10^2   0.00000000
8         yy     10^2   0.00000000
9         yz     10^2   0.00000000
10         1   10^2.5   0.00000000
11         x   10^2.5  -2.28064813
12         y   10^2.5   4.00588146
13         z   10^2.5 -10.72326346
14        xx   10^2.5   0.61528135
15        xy   10^2.5           NA
16        xz   10^2.5           NA
17        yy   10^2.5           NA
18        yz   10^2.5           NA
19         1     10^3   0.00000000
20         x     10^3  -0.01460549
21         y     10^3   5.26084263
22         z     10^3  -2.95040569
23        xx     10^3   0.00000000
24        xy     10^3   0.00000000
25        xz     10^3   0.00000000
26        yy     10^3   0.63388822
27        yz     10^3  -0.59157518
28         1   10^3.5   0.00000000
29         x   10^3.5  28.00000000
30         y   10^3.5  -1.00000000
31         z   10^3.5   0.00000000
32        xx   10^3.5   0.00000000
33        xy   10^3.5   0.00000000
34        xz   10^3.5  -1.00000000
35        yy   10^3.5   0.00000000
36        yz   10^3.5   0.00000000
37         1     10^4   0.00000000
38         x     10^4  28.00000000
39         y     10^4  -1.00000000
40         z     10^4   0.00000000
41        xx     10^4   0.00000000
42        xy     10^4   0.00000000
43        xz     10^4  -1.00000000
44        yy     10^4   0.00000000
45        yz     10^4   0.00000000
46         1   10^4.5   0.00000000
47         x   10^4.5  28.00000000
48         y   10^4.5  -1.00000000
49         z   10^4.5   0.00000000
50        xx   10^4.5   0.00000000
51        xy   10^4.5   0.00000000
52        xz   10^4.5  -1.00000000
53        yy   10^4.5   0.00000000
54        yz   10^4.5   0.00000000
55         1     10^5   0.00000000
56         x     10^5  28.00000000
57         y     10^5  -1.00000000
58         z     10^5   0.00000000
59        xx     10^5   0.00000000
60        xy     10^5   0.00000000
61        xz     10^5  -1.00000000
62        yy     10^5   0.00000000
63        yz     10^5   0.00000000
I've edited and added data. By "hitting zero" I mean that the data points above at zero should no longer appear on the graph. Further, the data should only appear once it becomes nonzero.