I have made the following code:
ggplot() +
  geom_histogram(test, mapping = aes(reading_test), alpha = 0.3, colour = "Blue") +
  geom_histogram(test, mapping = aes(math_test), alpha = 0.3, colour = "Red") +
  geom_histogram(test, mapping = aes(science_test), alpha = 0.3, colour = "Orange") +
  labs(title = "Reading Test Score Histogram",
       x = "Reading Test Score Frequency",
       y = "Count") +
  theme_minimal() +
And I want to add a legend, for the colours blue, red and orange. But these are all seperate plots in one plot, so I don't know how to do it. I tried using colors and scale_color_manual but I can't seem to figure it out.
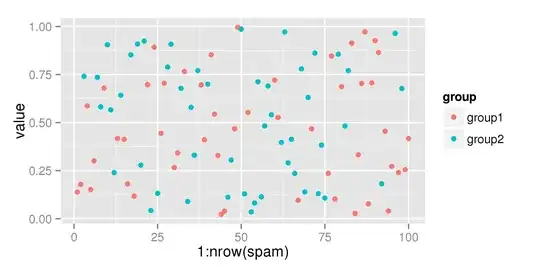
Image of the plot: