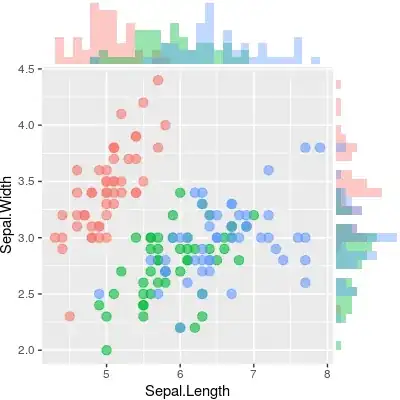
I've created a heatmap in R based on simulations and plotted it using image.plot() and I have added contour lines by using contour(). I also have a data frame that contains a column for observations in first year and trend size that I have plotted on top of the heatmap using base R plot. Is there an easy way to count the number of points below the 0.5 contour line and about the 0.95 contour line?

Asked
Active
Viewed 79 times
0
Julie Mugford
- 77
- 8
-
You may want to add a [mcve](https://stackoverflow.com/questions/5963269/how-to-make-a-great-r-reproducible-example/5963610#5963610). – jay.sf Aug 17 '20 at 08:33
1 Answers
0
Assuming you are plotting a variable called z, you can use something like.
table(z>.95)
nico
- 50,859
- 17
- 87
- 112