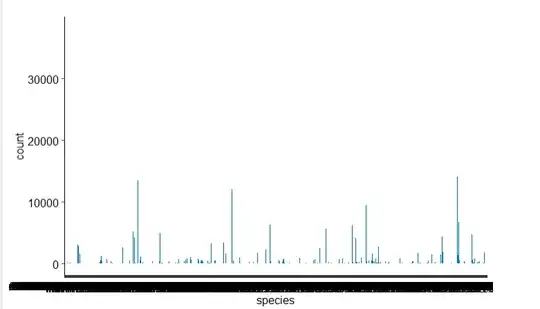
I have a dataframe DiatomFiltered containing the column species. I want to have a ggplot (ggplot2) of all species and their frequency ordered from highest to lowest. The below code works, but the names are a mess (because of way too many species names) so I want to remove that and i want the frequencies ordered. How do i do this?
ggplot(DiatomFiltered, aes(species)) +
  geom_bar(fill = "#0073C2FF")