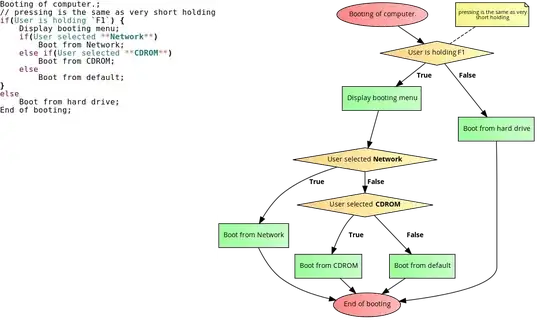
I am trying to plot a path diagram of a Structural Equation Model(SEM) in R. I was able to plot it using semPlot::semPaths(). The output is similar to  The SEM was modeled using
 lavaan package.
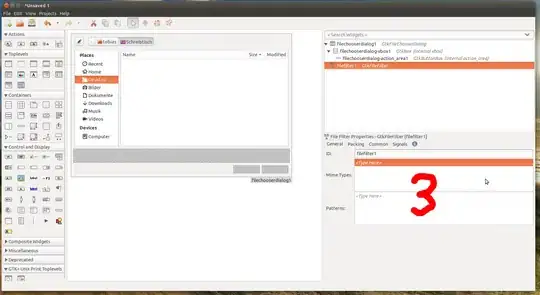
I want a plot similar to  . with estimates and p values. Can anyone help me out?
