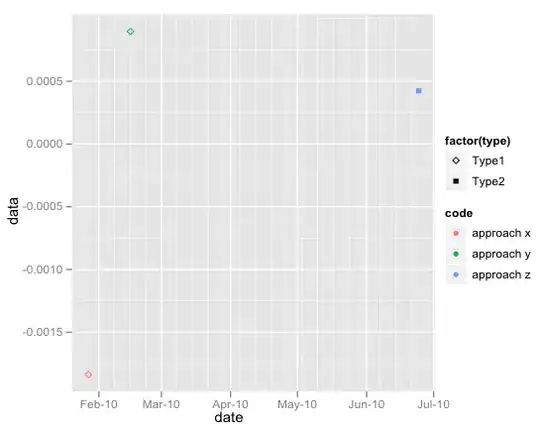
I have two legends on my ggplot with two different legend titles (automatically created from ggplot()). Now, I want to change this legend titles. + labs(colour = "legend name") only change the second legend title. How can I change the first one, too?
Sample data:
dataset <- structure(list(date = structure(c(1264572000, 1266202800, 1277362800),
class = c("POSIXt", "POSIXct"), tzone = ""),
x1 = c(-0.00183760994446658, 0.00089738603087497, 0.000423513598318936),
x2 = c("approach x","approach y","approach z"),
x3 = c("Type1", "Type1", "Type2")) ,
.Names = c("date", "data","code","type"),
row.names = c("1", "2", "3"), class = "data.frame")
Here is my code to produce the plot:
p <- ggplot(dataset, aes(x=date, y=data)) +
geom_point(aes(shape = factor(type), color = code)) +
scale_shape_manual(value=c(23,15))
print(p)
The legend titles are on default: "factor(type)" and "code":

