I guess you can mimic a "hypertext arrow" with a while loop and pause mouse.
For vectors it is better to have start/endpoints in one line, but that is a different topic. I will think about an answer about your other question.
Here, for simplicity, it is assumed that you have the start/endpoints already in one line.
the data is plotted once and then you enter a while loop (check help while) which you can stop by pressing ESC.
when button 1 of the mouse is pressed, the data is plotted again, but additionally, the dataline with the minimal distance to the mouse position (i.e. variables MOUSE_X and MOUSE_Y) is plotted with vectors. However, it seems you can't use MOUSE_X and MOUSE_Y in a function. So, well, then your have to assign it first to variables x0 and y0.
you could probably tune the behaviour of the appearance of the arrow, i.e. whether it disappears after some time or if you move on, etc...)
Script: (tested with gnuplot 5.4.1 and wxt and qt terminals)
### show arrow on mouse button press (mimic hypertext arrow)
reset session

$Data <<EOD
# first   # second
x1  y1    x2  y2
5   1     4   5
6   2     8   2
9   8     2   7
EOD

set offsets 1,1,1,1
set key out noautotitle

plot $Data u 1:2 w p pt 7 ps 2 lc "blue" ti "start point", \
        '' u 3:4 w p pt 7 ps 2 lc "red"  ti "end point"

dist(colX,colY) = sqrt((column(colX)-x0)**2 + (column(colY)-y0)**2)

continue = 1
while (continue) {
    pause mouse button1,keypress
    if (MOUSE_KEY == 27) { continue=0 }   # press ESC to stop loop
    else {
        x0 = MOUSE_X
        y0 = MOUSE_Y
        plot dMin=NaN \
            $Data u (d=dist(1,2), (dMin!=dMin || d<dMin)?(dMin=d,idxMin=$0):0,$1):2 skip 1 \
                w p pt 7 ps 2 lc "blue" ti "start point", \
            '' u (d=dist(3,4), d<dMin?(dMin=d,idxMin=$0):0,$3):4 w p pt 7 ps 2 lc "red"  ti "end point", \
            '' u 1:2:($3-$1):($4-$2) every ::idxMin::idxMin skip 1 w vec lw 2 lc black
    }
}
### end of script
Screen capture: (from wxt terminal)
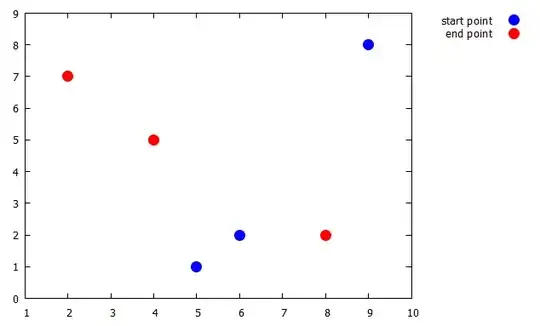
Addition: (keep and remove arrows)
Here is a version where you keep several arrows and you can remove them by clicking again close to their start/endpoint. You can remove all arrows at once if you do a right mouse click (on my system this is MOUSE_BUTTON==3).
- define a string
arrowIdxscontaining the selected arrows, i.e. line indices
- define a function
inList() which checks if an index is in the list
- define a function
updateList() which either adds a new index or removes an index if it was already in the list.
I hope you can figure out yourself how the script works in detail.
Check help <keyword> for the following used keywords: sprintf, sum, strstrt, strlen.
Script:
### show/hide arrows on mouse button click
reset session

$Data <<EOD
# first   # second
x1  y1    x2  y2
5   1     4   5
6   2     8   2
9   8     2   7
EOD

set offsets 1,1,1,1
set key out noautotitle

plot $Data u 1:2 w p pt 7 ps 2 lc "blue" ti "start point", \
        '' u 3:4 w p pt 7 ps 2 lc "red"  ti "end point"

dist(colX,colY) = sqrt((column(colX)-x0)**2 + (column(colY)-y0)**2)

arrowIdxs = ''
inList(list,n)     = (_s=sprintf("%d",n), int(sum[_i=1:words(list)] word(list,_i) eq _s))
updateList(list,n) = (_s=sprintf("%d",n), inList(list,n) ? \
      list[1:strstrt(list,_s)-2].list[strstrt(list,_s)+strlen(_s):] : list.' '.sprintf("%d",n))

continue = 1
while (continue) {
    pause mouse button1,button3,keypress
    if (MOUSE_KEY == 27) { continue=0 }   # press ESC to stop loop
    else {
        mb=MOUSE_BUTTON
        if (mb==1) {
            x0 = MOUSE_X
            y0 = MOUSE_Y
            plot dMin=NaN \
                $Data u (d=dist(1,2), (dMin!=dMin || d<dMin)?(dMin=d,idxMin=$0):0,$1):2 skip 1 \
                    w p pt 7 ps 2 lc "blue" ti "start point", \
                '' u (d=dist(3,4), d<dMin?(dMin=d,idxMin=$0):0,$3):4 w p pt 7 ps 2 lc "red"  ti "end point", \
                arrowIdxs = updateList(arrowIdxs,idxMin) \
                '' u (inList(arrowIdxs,$0)? $1:NaN):2:($3-$1):($4-$2) skip 1 w vec lw 2 lc black
        }
        if (mb==3) {
            arrowIdxs = ''
            plot $Data u 1:2 w p pt 7 ps 2 lc "blue" ti "start point", \
                    '' u 3:4 w p pt 7 ps 2 lc "red"  ti "end point"
        }
    }
}
### end of script
Screen capture: (from wxt terminal)