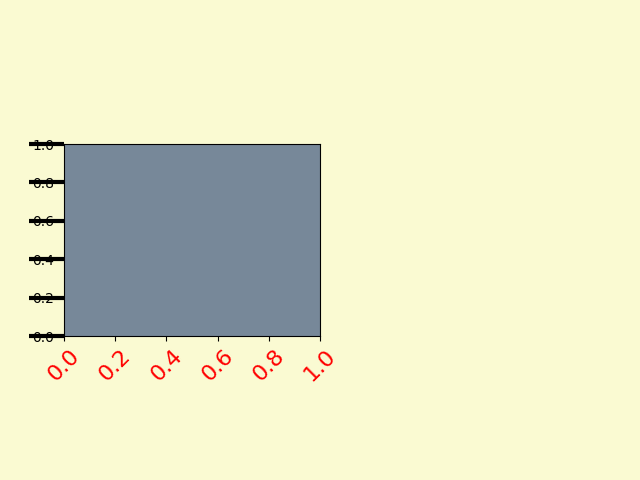
Here is an example from matplotlib tutorials
# plt.figure creates a matplotlib.figure.Figure instance
fig = plt.figure()
rect = fig.patch  # a rectangle instance
rect.set_facecolor('lightgoldenrodyellow')

ax1 = fig.add_axes([0.1, 0.3, 0.4, 0.4])
rect = ax1.patch
rect.set_facecolor('lightslategray')


for label in ax1.xaxis.get_ticklabels():
    # label is a Text instance
    label.set_color('red')
    label.set_rotation(45)
    label.set_fontsize(16)

for line in ax1.yaxis.get_ticklines():
    # line is a Line2D instance
    line.set_color('green')
    line.set_markersize(25)
    line.set_markeredgewidth(3)

plt.show()
https://matplotlib.org/3.5.3/_images/sphx_glr_artists_004.png
but line.set_color('green') dont work, while line.set_markeredgecolor('green') is ok.I dont know why.
line.set_color('green') dont work, while line.set_markeredgecolor('green') is ok. I am confused.