I managed to plot the means as a line, however, I do not know how to plot their respective standard deviation as geom_smooth.
When I just use the geom_smooth function, it does not seem to plot the correct standard deviation.
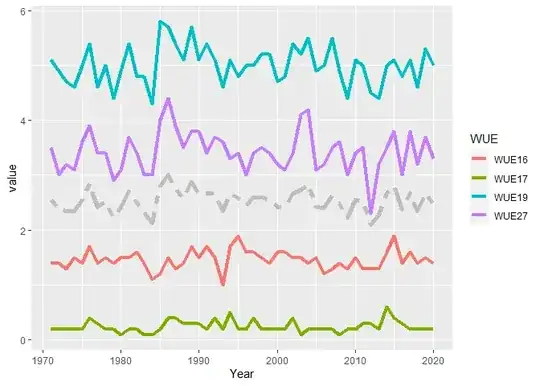
This is my code so far:
library("ggplot2")

df <- data.frame(wue_r$WUE19, wue_r$WUE27, wue_r$WUE16, wue_r$WUE17)

mean <- rowMeans(df)

wue_fin<-cbind(wue_r, means = mean)

colors <- c("WUE16"="chartreuse", "WUE19"="chartreuse3",  "WUE27"="darkgreen", "WUE17"="darkolivegreen", "means"="black")

plot1 <- ggplot(wue_fin, aes(x=Year)) +
  geom_line(aes(y=WUE16, color="WUE16"), linewidth=1.75) +
  geom_line(aes(y=WUE19, color="WUE19"), linewidth=1.75) +
  geom_line(aes(y=WUE27, color="WUE27"), linewidth=1.75) +
  geom_line(aes(y=WUE17, color="WUE17"), linewidth=1.75) +
  geom_smooth(aes(y=means, color="means"), span=0.2, fill="grey", linetype="twodash", linewidth=2) +
  labs(color="Legend") +
  scale_color_manual(values=colors)`
Thanks in advance!