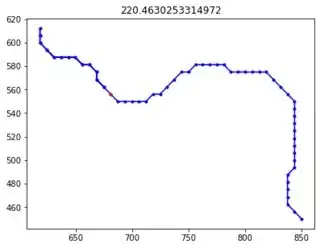
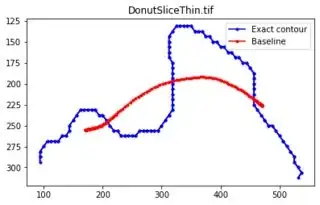
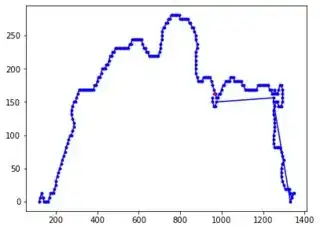
I have images like below and I want to extract the contour and having the vertices in clockwise or counterclockwise order. I need to use them for some calcuations so it must ordered so the points are found by traversing the outline.
I tried using cv2.findContours() however, it returns the contour closed.
Title is the script's current execution time.
You can see that it clearly doubles back.
I tried extracting just the unique coordinates but that causes some issues with the ordering. (Ignore the red line)
Code to extract contour:
code
 dirPictures = os.listdir(sourcePath)

 for path in dirPictures:
    if( '.' in path and path.split('.')[-1].lower() in acceptedFileTypes):

        #Reset plots to default figure size
        plt.rcParams["figure.figsize"] = plt.rcParamsDefault["figure.figsize"]
        plt.gca().invert_yaxis()


        # Extract contour
        img = cv2.imread(sourcePath + '/' + path, cv2.IMREAD_GRAYSCALE)
        cont, hier = cv2.findContours(img, cv2.RETR_LIST, cv2.CHAIN_APPROX_NONE)
Edit:
I thought the idea of using np.where() and sorting worked but it still fails in a few cases. The countour vertices are not starting at the edges of outline so I don't believe sorting will work.
Edit 2:
I attempted to use the svg path but that also failed. I utilized tatrize's potracer here
Code:
        # Extract contour
        img = cv2.imread(sourcePath + '/' + path, cv2.IMREAD_GRAYSCALE)
        img = np.array(img)

        # Create a bitmap from the array
        bmp = potrace.Bitmap(img)

        # Trace the bitmap to a path
        path = bmp.trace()

        # Iterate over path curves
        x = []
        y = []

        for curve in path:
            print ("start_point =", curve.start_point)
            for segment in curve:
                print(segment)
                end_point_x, end_point_y = segment.end_point.x, segment.end_point.y
                if segment.is_corner:
                    c_x, c_y = segment.c.x, segment.c.y
                else:
                    c1_x, c1_y = segment.c1.x, segment.c1.y
                    c2_x, c2_y = segment.c2.x, segment.c2.y
                    x.append(c1_x)
                    y.append(c1_y)
                    x.append(c2_x)
                    y.append(c2_y)

        #turn into array of coord pairs [[x,y]...]
        k = np.stack((x,y), axis=-1)

        #Keep unique, ordered points
        _, idx = np.unique(k, axis=0,  return_index=True)
        k = k[np.sort(idx)]

        plt.plot(k[:,0], k[:,1], 'g.-')
        plt.show()


