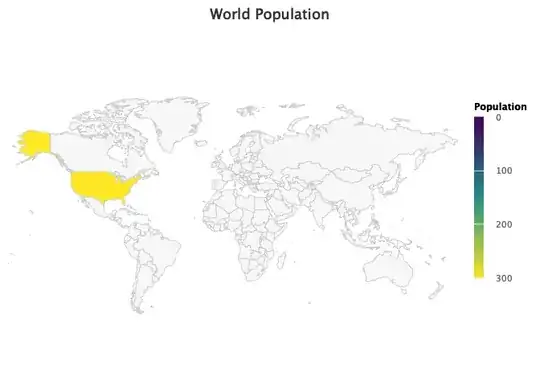
I have a problem with this code. The map appears but without color. I have installed tidiverse, highcharter, geonames,ggplot2, gganimate, maps, ggmap. Should I install some more packages?
population<-baza %>%
  select(Country, Population)


highchart() %>%
  hc_add_series_map(worldgeojson, df=population, value="Population", joinBy = "Country") %>%
  hc_colorAxis(stops=color_stops()) %>%
  hc_title(text="World Population") %>%
  hc_tooltip(useHTML = TRUE,
             formatter = JS(
               "function(){",
               "  return '<b><u>'+this.point.Country+'</u></b><br>'",
               "         +'<b>Population:</b> '+parseInt(this.point.value);",
               "}"
             )
  ) %>%
  hc_legend(
    enabled = TRUE,
    title = list(text = "Population"),
    layout = "vertical",
    align = "right",
    verticalAlign = "middle"
  )
Baza is my data frame with columns Country and Population. Should something be added to this code?
