I am trying to use a for loop in a data.frame to create a number of plots using ggplot. The number of plots vary in different situations. The code I am using is the follow:
for(i in colnames(AUX_GRAF[2: ncol(AUX_GRAF)])){
  AUX01 <- as.numeric(AUX_GRAF[, i])
  AUX <- ggplot (AUX_GRAF,
                              aes(x = reorder(SE, as.numeric(SE)),
                                  y = AUX01)) +
  theme(axis.text.x = element_text(face = "bold")) +
  labs(caption = "Fonte",
       x = "Semana Epidemiológica",
       y = "Número de Casos",
       title = paste0(i, " - Notificados"))+
  theme( panel.grid.major = element_line(color = "#C0C0C0"),
         panel.grid.minor = element_blank(),
         panel.background = element_rect(fill = "#F5F5F5"),
         plot.title = element_text(face = "bold",
                                   size = 15,
                                   colour = "#556B2F")) +
  geom_bar(stat = "identity",
           color = "black",
           fill = "#8FBC8F") +
  geom_label(aes(label = AUX01),
             alpha = 0.5,
             vjust = 0.1) +
  scale_y_continuous(expand = expansion(mult = c(0, 0.05)))
  assign(paste0("SE_HIST_NOT_", i), AUX)
    Sys.sleep(1)
    print(assign(paste0("SE_HIST_NOT_", i), AUX))
    rm(AUX)
}
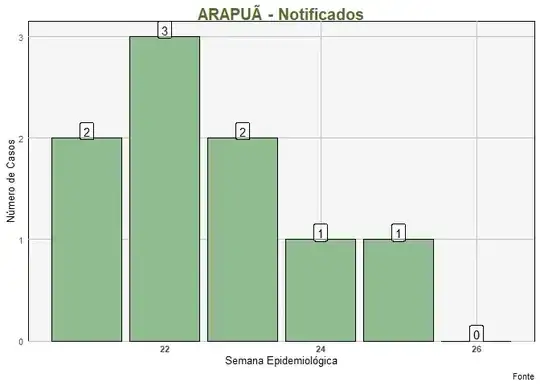
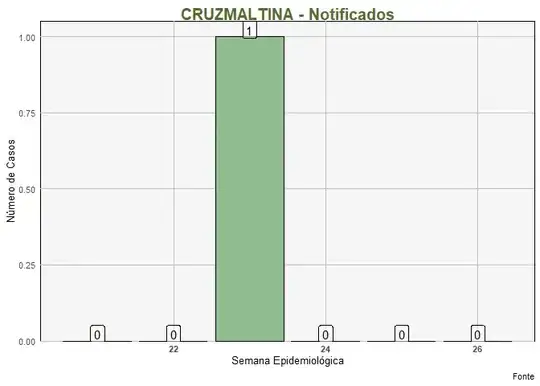
AUX_GRAF is the data.frame I am trying to plot. I try different ways to do it and every way I get the same result. The geom_label is right, the title is right, but the geon_bar is always the same as the last iteration.
I do not know what is happening.
I put the Sys.sleep and the rint(assign(paste0("SE_HIST_NOT_", i), AUX)) in the end of the loop to see what is happening, but the plots inside the loop are right.But when I try to plot outside of the loop I have the problem above.
AUX_GRAF
> dput(head(AUX_GRAF))
structure(list(SE = c("21", "22", "23", "24", "25", "26"), ARAPUÃ = c(2,
3, 2, 1, 1, 0), ARIRANHA_DO_IVAÍ = c(0, 0, 0, 0, 0, 1), CÂNDIDO_DE_ABREU = c(1,
0, 0, 1, 0, 0), CRUZMALTINA = c(0, 0, 1, 0, 0, 0), GODOY_MOREIRA = c(0,
1, 0, 0, 0, 0), IVAIPORÃ = c(39, 32, 18, 16, 14, 10), JARDIM_ALEGRE = c(11,
19, 7, 2, 0, 0), LIDIANÓPOLIS = c(22, 18, 9, 9, 4, 11), LUNARDELLI = c(12,
2, 3, 3, 7, 2), MANOEL_RIBAS = c(5, 5, 1, 0, 3, 1), MATO_RICO = c(0,
0, 0, 0, 0, 0), NOVA_TEBAS = c(15, 19, 11, 7, 3, 5), RIO_BRANCO_DO_IVAÍ = c(10,
1, 0, 0, 0, 0), ROSÁRIO_DO_IVAÍ = c(0, 0, 0, 0, 0, 0), SANTA_MARIA_DO_OESTE = c(0,
0, 0, 0, 0, 0), SÃO_JOÃO_DO_IVAÍ = c(3, 2, 0, 0, 0, 1)), row.names = c(NA,
6L), class = "data.frame")