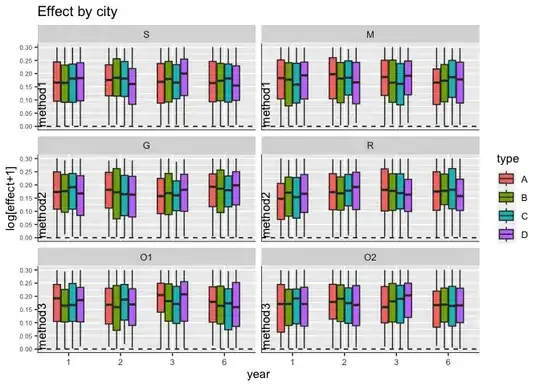
I have a dataset for 6 sites (cities) and two sites each are in another category called 'method'. I want to make graphs of each site using facet_wrap in two columns (3 rows corresponding to each method) and add the method name as a vertical label on each of the three rows. I want the site name as a horizontal label in each facet.
I can't use facet_grid because that labels columns and/or rows, but not individual facets and it creates a 2x6 pattern instead of a 3x2 pattern. Is there a way to use facet_wrap and add vertical labels using a categorical variable? I realize I can add the site name as text for each graph, but I would prefer to use labels, especially because of placement issues and the bar plots.
    ggplot(effect, aes(x=year, y= log10(effect+1), fill=type))+
    geom_boxplot(width=0.6)+
    facet_wrap(~factor(city_f, levels=c('S','M','G','R','O1','O2')), ncol = 2, labeller =             as_labeller(new_labels2))+
    scale_y_continuous(n.breaks = 8)+
    theme(axis.text.x = element_text(size = 8), axis.text.y = element_text(size = 6))+
    labs(x="year", y="log[effect+1]", title="Effect by city")+
    geom_hline(yintercept=0,linetype="dashed")+
    geom_hline(aes(yintercept=-Inf)) +
    geom_vline(aes(xintercept=-Inf))
The sites are already in the correct rows to match the method variable.
I tried
facet_wrap(method~factor(city_f....
and
facet_grid(method~factor(city_f....
