As of July 2018, there are several packages that help create multi-panel plots nicely. See examples below
library(ggplot2)
theme_set(theme_bw())
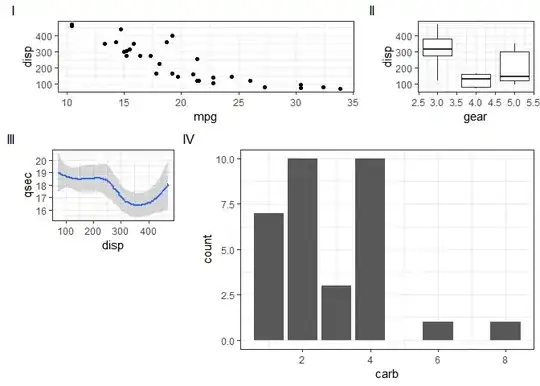
q1 <- ggplot(mtcars) + geom_point(aes(mpg, disp))
q2 <- ggplot(mtcars) + geom_boxplot(aes(gear, disp, group = gear))
q3 <- ggplot(mtcars) + geom_smooth(aes(disp, qsec))
q4 <- ggplot(mtcars) + geom_bar(aes(carb))
library(grid)
library(egg)

ggarrange(q1, q2, q3, q4,
          ncol = 2,
          top = "Plot title",
          bottom = textGrob(
            "This footnote is right-justified",
            gp = gpar(fontface = 3, fontsize = 10),
            hjust = 1, x = 1)
          )
#> `geom_smooth()` using method = 'loess' and formula 'y ~ x'

library(cowplot)

plot_grid(q1, q2, q3, q4,
          ncol = 2,
          labels = "AUTO")
#> `geom_smooth()` using method = 'loess' and formula 'y ~ x'

library(patchwork)

q1 + q2 + q3 + q4 +
  plot_layout(ncol = 2) +
  plot_annotation(title = "Plot title",
                  subtitle = "Plot subtitle",
                  tag_levels = 'A',
                  tag_suffix = ')')
#> `geom_smooth()` using method = 'loess' and formula 'y ~ x'

# complex layout 1
q1 + {
  q2 + plot_spacer() + {
    q3 +
      q4 +
      plot_layout(ncol = 1)
  }
} +
  plot_layout(ncol = 1)
#> `geom_smooth()` using method = 'loess' and formula 'y ~ x'

# complex layout 2
(q1 | q2 | q3) /
  q4
#> `geom_smooth()` using method = 'loess' and formula 'y ~ x'

# bonus: working with grob objects
p1 <- ggplot(mtcars) + geom_boxplot(aes(gear, disp, group = gear))
table1 <- tableGrob(mtcars[1:6, 1:4])
patchwork::wrap_plots(list(p1, table1), nrow = 1)

library(magrittr)
library(multipanelfigure)

figure1 <- multi_panel_figure(columns = 2, rows = 2, panel_label_type = "none")
# show the layout
figure1
figure1 %<>%
  fill_panel(q1, column = 1, row = 1) %<>%
  fill_panel(q2, column = 2, row = 1) %<>%
  fill_panel(q3, column = 1, row = 2) %<>%
  fill_panel(q4, column = 2, row = 2)
#> `geom_smooth()` using method = 'loess' and formula 'y ~ x'
figure1

# complex layout
figure2 <- multi_panel_figure(columns = 3, rows = 3, panel_label_type = "upper-roman")

figure2 %<>%
  fill_panel(q1, column = 1:2, row = 1) %<>%
  fill_panel(q2, column = 3, row = 1) %<>%
  fill_panel(q3, column = 1, row = 2) %<>%
  fill_panel(q4, column = 2:3, row = 2:3)
#> `geom_smooth()` using method = 'loess' and formula 'y ~ x'
figure2
Created on 2018-07-06 by the reprex package (v0.2.0.9000).