After some research, the most common CDT profilers are GProf and valgrind.
A good tutorial for GProf can be found here.
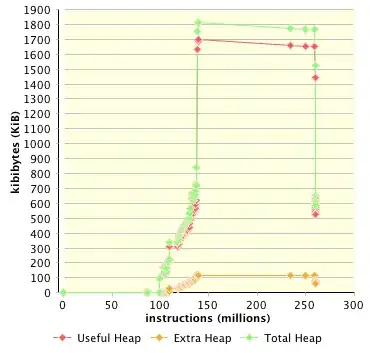
As I'm using MacOSX, GProf is not usable, because it bases on system calls that seem to have vanished from MacOSX some versions ago. Therefore I recommend valgrind (in combination with Massif) - it works like a charm on my apple and fulfills all my needs (heap usage graph, see below). Both softwares can be found here.
EDIT: massif output is better viewed with (guess what) the massif viewer by Milian Wolff (native on KDE, ports for MacOSX are available). Just feed in the massif output (valgrind --tool=massif {appname}).