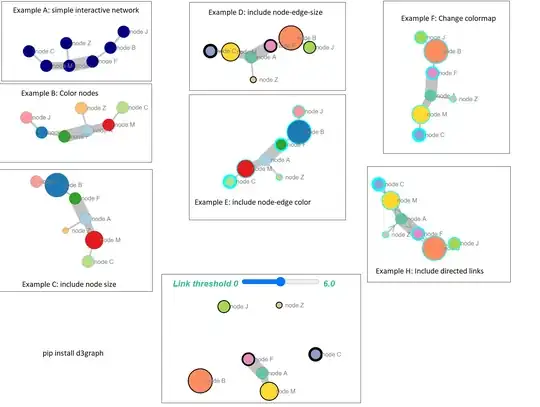
The library d3graph will build a force-directed d3-graph from within python. You can "break" the network based on the edge weight, and hover over the nodes for more information. Double click on a node will focus on the node and its connected edges.
pip install d3graph
Example:
# Import library
from d3graph import d3graph, vec2adjmat

source = ['node A','node F','node B','node B','node B','node A','node C','node Z']
target = ['node F','node B','node J','node F','node F','node M','node M','node A']
weight = [5.56, 0.5, 0.64, 0.23, 0.9,3.28,0.5,0.45]

# Convert to adjacency matrix
adjmat = vec2adjmat(source, target, weight=weight)

print(adjmat)
# target  node A  node B  node F  node J  node M  node C  node Z
# source
# node A    0.00     0.0    5.56    0.00    3.28     0.0     0.0
# node B    0.00     0.0    1.13    0.64    0.00     0.0     0.0
# node F    0.00     0.5    0.00    0.00    0.00     0.0     0.0
# node J    0.00     0.0    0.00    0.00    0.00     0.0     0.0
# node M    0.00     0.0    0.00    0.00    0.00     0.0     0.0
# node C    0.00     0.0    0.00    0.00    0.50     0.0     0.0
# node Z    0.45     0.0    0.00    0.00    0.00     0.0     0.0

# Initialize
d3 = d3graph()

# Process adjacency matrix
d3.graph(adjmat)
d3.show()

# Example B: Color nodes
d3.set_node_properties(color=adjmat.columns.values, size=size)
d3.show()

# Example C: include node size
size = [10,20,10,10,15,10,5]
d3.set_node_properties(color=adjmat.columns.values, size=size)
d3.show()

# Example D: include node-edge-size
d3.set_node_properties(color=adjmat.columns.values, size=size, edge_size=size[::-1], cmap='Set2')
d3.show()

# Example E: include node-edge color
d3.set_node_properties(color=adjmat.columns.values, size=size, edge_size=size[::-1], edge_color='#000000')
d3.show()

# Example F: Change colormap
d3.set_node_properties(color=adjmat.columns.values, size=size, edge_size=size[::-1], edge_color='#00FFFF', cmap='Set2')
d3.show()

# Example G: Include directed links. Arrows are set from source -> target
d3.set_edge_properties(directed=True)
d3.set_node_properties(color=adjmat.columns.values, size=size, edge_size=size, edge_color='#000FFF', cmap='Set1')
d3.show()

- More examples and information can be found at the github documentation pages.
- Interactive example from the titanic-case can be found here.
- If you need more context how d3graph is developed, read the blog here.
