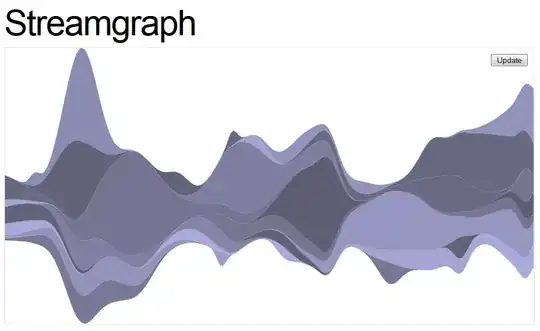
I'm learning D3.js and trying to get my head around data keys used with streamgraphs. I would like to adapt the official streamgraph example:

...so that each path has an explicit data key, and so that the mouseover logs the data key.
The official example adds paths as follows:
var area = d3.svg.area()
   .x(function(d) { console.log('x', d.data); return d.x * w / mx; })
   .y0(function(d) { return h - d.y0 * h / my; })
   .y1(function(d) { return h - (d.y + d.y0) * h / my; });
vis.selectAll("path")
 .data(data0)
 .enter().append("path")
 .style("fill", function() { return color(Math.random()); })
 .attr("d", area);
I tried adapting the code as follows, but I'm not sure how to change the structure of data0 (currently an array of arrays) to achieve what I want:
vis.selectAll("path")
 .data(data0, function(d) { return d.name }) // Add key function
 .enter().append("path")
 .style("fill", function() { return color(Math.random()); })
 .attr("d", area)
 .on("mouseover", function (d,i) {
     console.log("mouseover", d.name); // Log name property on mouseover
  });
As it stands, without my having made any changes to the structure of data0, it unsurprisingly does not work. How can I add a name property to data0 without also messing up the area and .data() functions?
UPDATE: To be a bit clearer: the D3 docs say that the area function is expecting a two-dimensional array. So if I change data0 from a two-dimensional array, to an array of objects, each with a name key and a data key, how can I also change what I pass to area?