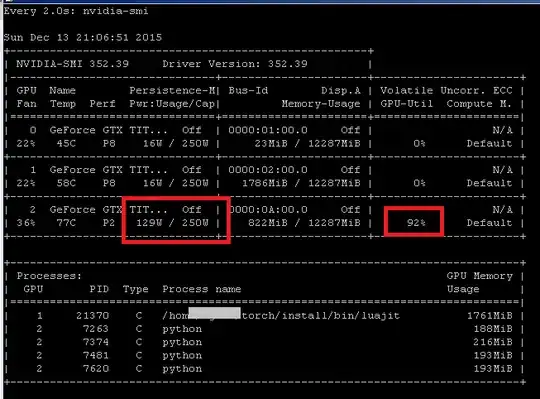
Usually, it means that your CUDA program is suboptimal. I'm now optimizing my CUDA program. I wrote several iterations of it, improving the performance in each iteration. So surprisingly, in each iteration, it was reporting 100% of GPU Load. But power consumption was different in each iteration. In the latest iteration, with the increase of power consumption from 40% to 70%, my program has been improved 7 times (!!!) in terms of the wall time it takes to compute what I need.
GPU mostly stalls on memory operations. I optimized for better caching (i.e. less global memory hits), and I got the following changes of sensors:
- Gpu load: stays at 100%
- Memory controller load: increased from 20% to 25%
- Power consumption: increased from 40% to 70%
- Wall time to perform the computation: decreased 7 times
Unfortunately, the source code is proprietary, so I can't give it to you to try yourself. However, you can get some idea of what the bottleneck in my program does: it is a loop with one memory read from an array (ith item), an addition and a multiplication, and an assignment of float.
