2

Is there a (possibly spreadsheet?) program that enables manipulation of 3D data? The problem:

  • There're several tables (A, B, C, …)
  • Each table (an m x n matrix) represents measured quantities of a system at one point in time
  • (Each table describes the same system, just in a different point in time)
  • E.g. table A = state of the system in time t=0, table B = state of the system in time t=1, …

I'd like to be able to display a 3D spreadsheet containing the evolution of the system in time and scroll between the tables (possibly with the ability of graph-visualization).

To illustrate the situation better:

          .
         /|\
          |  time axis
          |

t = 2        +-------+
             |       |
             |   C   |
             |       |
             |       |
t = 1     +-------+  |
          |       |--+
          |   B   |
t = 0  +-------+  |
       |       |  |
       |   A   |  |
       |       |--+
       |       |
       |       |
       +-------+
sarasvati
  • 123

1 Answers1

2
  • Since coordinate axes are defined X,(horiz) Z, (depth) , Y (vertical)

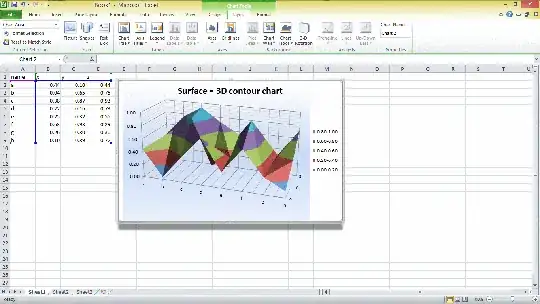
  • The graph wizard expects you to have names in 1st column and row and then columns X,Y,Z for each data point.

  • create this XYZ table using your separate tables which share 2 of the 3 axes. When you explictly create this table using links to each table and then copy down the entries you need to fill the missing axis fixed value for each table.

  • The result is an automated colour-coded vertical layer for the automated range used.

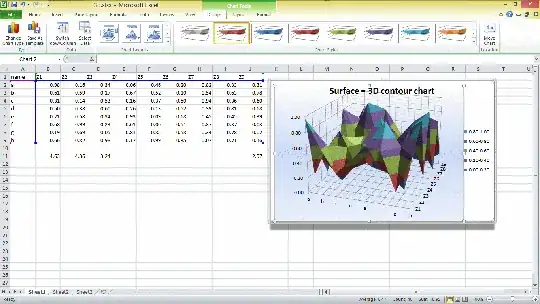
  • here is an example using =RAND() in each cell giving results from 0 to 1. enter image description here

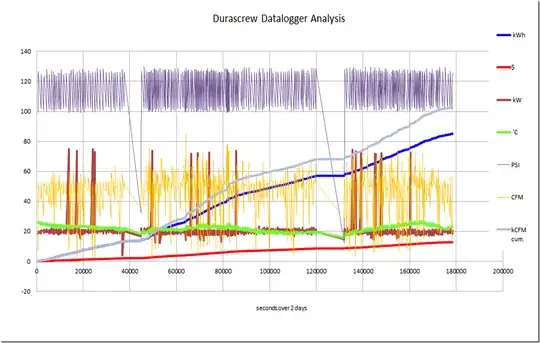
Alternatively if you have N sets of data as a function of X axis (time) you can use a scatter chart with common X axis for all and secondary axis for values with a wide difference from the rest.

  • or use a surface chart if the data is all related but different sensors. enter image description here

enter image description here