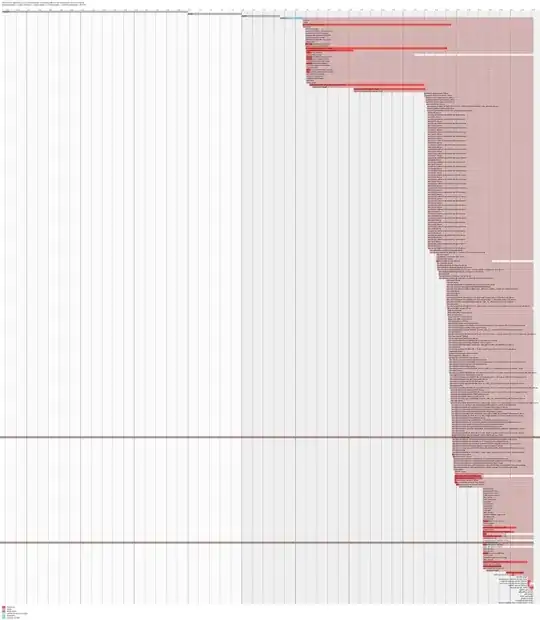
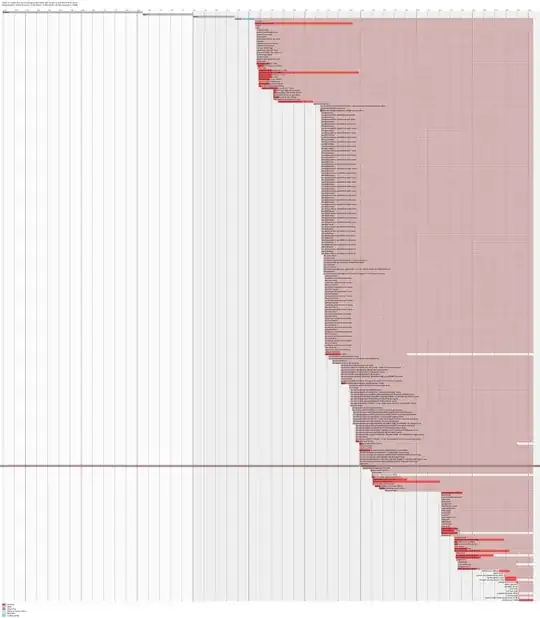
I understand that solving long boot times involves analyzing how long it takes to boot up what, but the output of systemd-analyze blame and systemd-analyze plot has left me puzzled.
~ $ systemd-analyze
Startup finished in 12.557s (firmware) + 4.516s (loader) + 3.732s (kernel) + 26.720s (userspace) = 47.526s
~ $ systemd-analyze blame | grep "\s[1-9]*\."
          8.989s keyboard-setup.service
          8.757s dev-sda2.device
          6.055s apparmor.service
          4.948s accounts-daemon.service
          4.446s NetworkManager.service
          3.383s gpu-manager.service
          3.134s systemd-udevd.service
          3.079s snapd.firstboot.service
          2.440s udisks2.service
          2.249s grub-common.service
          2.093s upower.service
          1.943s networking.service
          1.661s avahi-daemon.service
          1.461s rsyslog.service
          1.460s pppd-dns.service
          1.449s systemd-tmpfiles-setup-dev.service
          1.387s systemd-rfkill.service
          1.290s colord.service
          1.210s resolvconf.service
          1.192s apport.service
          1.188s systemd-modules-load.service
          1.187s systemd-remount-fs.service
          1.166s dev-mqueue.mount
          1.152s bluetooth.service
          1.032s lightdm.service
          1.013s plymouth-quit-wait.service
Information
The machine is a Dell Inspiron 5559; I've had it since February/March 2016.
~ $ uname -imporvs
Linux 4.8.0-32-generic #34-Ubuntu SMP Tue Dec 13 14:30:43 UTC 2016 x86_64 x86_64 x86_64 GNU/Linux
Distro is Lubuntu 16.10 w/LXDE.
~ $ sudo parted /dev/sda unit mib print
Model: ATA ST1000LM024 HN-M (scsi)
Disk /dev/sda: 953870MiB
Sector size (logical/physical): 512B/4096B
Partition Table: gpt
Disk Flags:

Number  Start      End        Size       File system     Name                  Flags
 1      1.00MiB    513MiB     512MiB     fat32           EFI System Partition  boot, esp
 2      513MiB     937591MiB  937078MiB  ext4
 3      937591MiB  953869MiB  16278MiB   linux-swap(v1)
Worst part is, the times of the individual modules vary a bit (1 to 2 seconds, observed from following this problem since I installed Lubuntu), which means I would need to update systemd-analyze blame constantly or log a series of reboots and then make an average.
Can anyone tell me where I could start?
UPDATE
Upgrading from 16.10 to 17.04 viasudo apt dist-upgrade changed the situation considerably.
~ $ systemd-analyze blame | grep "\s[1-9]*\."
         16.083s dev-sda2.device
         15.435s keyboard-setup.service
          8.015s systemd-udevd.service
          4.090s NetworkManager.service
          3.644s systemd-tmpfiles-setup-dev.service
          2.621s apparmor.service
          2.549s grub-common.service
          2.477s plymouth-read-write.service
          1.560s accounts-daemon.service
          1.107s systemd-modules-load.service
          1.002s colord.service
~ $ systemd-analyze critical-chain
The time after the unit is active or started is printed after the "@" character.
The time the unit takes to start is printed after the "+" character.

graphical.target @25.631s
└─multi-user.target @25.631s
  └─getty.target @25.631s
    └─getty@tty1.service @25.631s
      └─system-getty.slice @25.630s
        └─setvtrgb.service @25.407s +222ms
          └─systemd-user-sessions.service @25.245s +2ms
            └─network.target @25.245s
              └─NetworkManager.service @21.154s +4.090s
                └─dbus.service @21.147s
                  └─basic.target @21.139s
                    └─sockets.target @21.139s
                      └─snapd.socket @21.136s +2ms
                        └─sysinit.target @21.110s
                          └─apparmor.service @18.488s +2.621s
                            └─local-fs.target @18.488s
                              └─boot-efi.mount @18.387s +100ms
                                └─systemd-fsck@dev-disk-by\x2duuid-7930\x2d6EDD.service @18.198s +150ms
                                  └─dev-disk-by\x2duuid-7930\x2d6EDD.device @18.198s
 At least clear culprits are appearing.
CLOSED
The post is being closed because I have migrated to another distro (Gentoo) where the problem has not arisen, so the question is no longer relevant.
