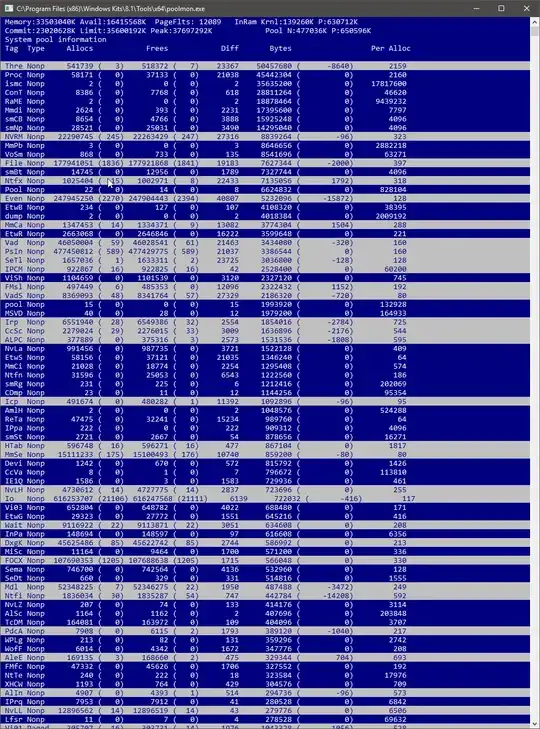
The "low on memory", "out of memory", etc., usually have nothing to do with free RAM, rather with the commit charge vs. commit limit.
It would be useful to see a screen snapshot of Task Manager's Performance tab, Memory section, as this will show the commit charge and limit.
However, two things do look abnormal here, and I suspect these are enough to determine the root of the problem: You have about 21,000 process objects ("Proc") and about 23,000 thread objects ("Thre").
For comparison: My system right here, also Windows 10, has been up for about 10 days and only has about 200 and 3200 of these objects, respectively.
This probably indicates that you have some program running that is madly creating processes and not allowing them to completely exit, perhaps by not closing the handles to them and/or to their threads. Although they are not impacting your RAM much right now (they occupy about 100 MB of nonpaged pool total), if processes and threads continue to be created and not deleted, they will eventually consume almost all of your RAM. RAM committed to the nonpaged pool does contribute to "commit charge", which is why these will eventually result in "low on memory" or "out of memory" errors.
A quick way to find the culprit may be look at Task Manager's Details tab. Add the "Handles" column, sort by that column, and see if anything looks abnormally high, and particularly if it's constantly increasing.
n.b.: The "threads" column will likely not be helpful. It would be helpful if you were looking for one process with a whole bunch of threads - which is not an impossible thing to happen - but the fact that there are about as many processes as threads here argues against that. With every process you get one thread (to start), so a plague of processes brings a plague of the same number of threads with it - but this won't show up in any one process's "threads" counter.
The "process tree" view of the sysinternals tool Process Explorer may, however, help. You're looking for a process with a whole lot of processes "under" it.
If that doesn't do it, try using the sysinternals ProcMon tool and look for process creation events.
If that doesn't do it, then it's probably being done in a kernel driver. Use the Windows Performance Toolkit to find process creation events.
For more on commit charge, see my answers to the questions I've linked below. Usually, running out of commit charge is fixed by either adding RAM or increasing your pagefile size (or running less stuff at one time), but those methods will not help with this problem. Nonpaged pool can't be paged out, so these Proc and Thre objects necessarily occupy RAM. And even if your pagefile is large enough to avoid running out of commit limit, the system will eventually show other problems due to shortage of usable RAM.
Windows says RAM ran out while there is still 4 GB of physical memory available
How does memory/commit charge work in Windows 10?
