I am working with data in groups in Excel. I currently have a pivot table and chart set up with:
- Rows:
symptom namegrouped into one of fourinternational severity grades - Columns: four datasets -
mild,severe,bothornot specified.
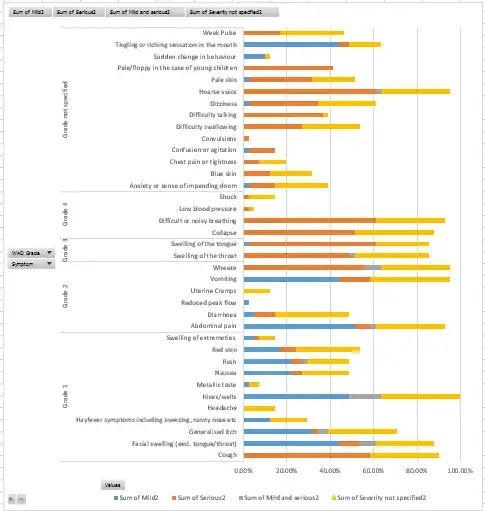
I need to present these as a stacked bar chart, which I have been able to do as below:
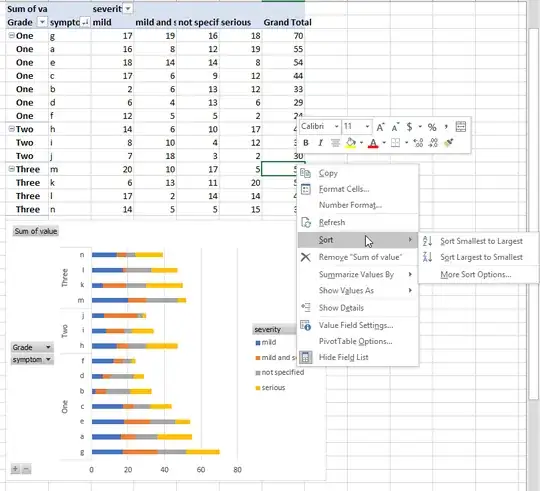
As you can see, they are grouped into their international severity grades nicely but are arranged randomly within their groups. I would like them to be sorted descending by the sum of mild + severe + both + not specified within their groups, but I can't find a way to do this.
The closest I have come so far is to have a calculated field that works out this field - but then this displays as a fifth column category on the graph and I can't seem to remove it.
Does anyone have a way to do this? I think I may be able to drag and drop them into the right positions, but this will take a while so if there is a better way I would be really grateful!


